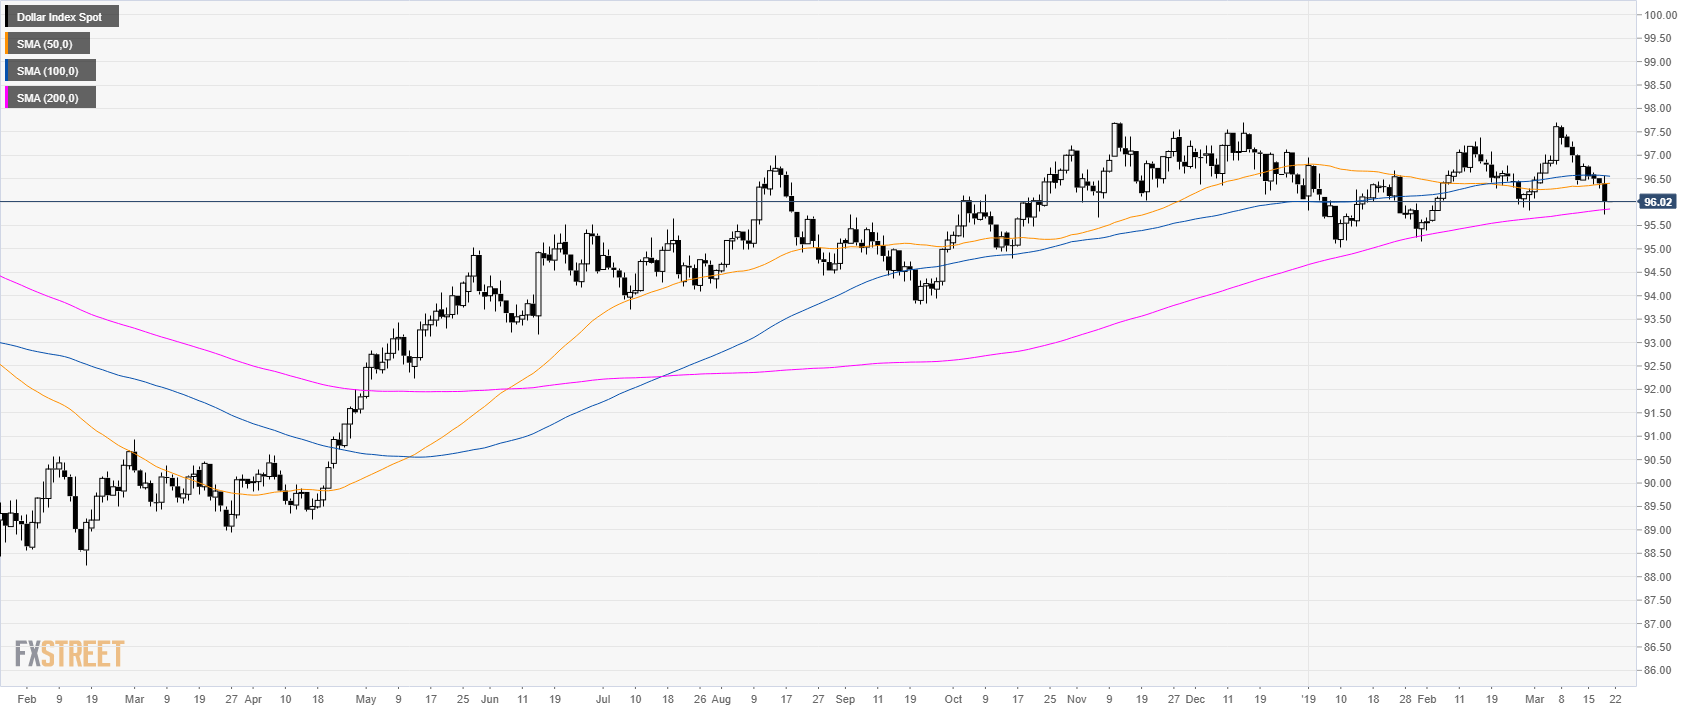
DXY daily chart
- The US Dollar Index (DXY) is trading in a bull trend above its 200-day simple moving average (SMA).
- DXY dropped to the 96.10 and 95.82 levels as the FOMC turned out to be more dovish than expected.
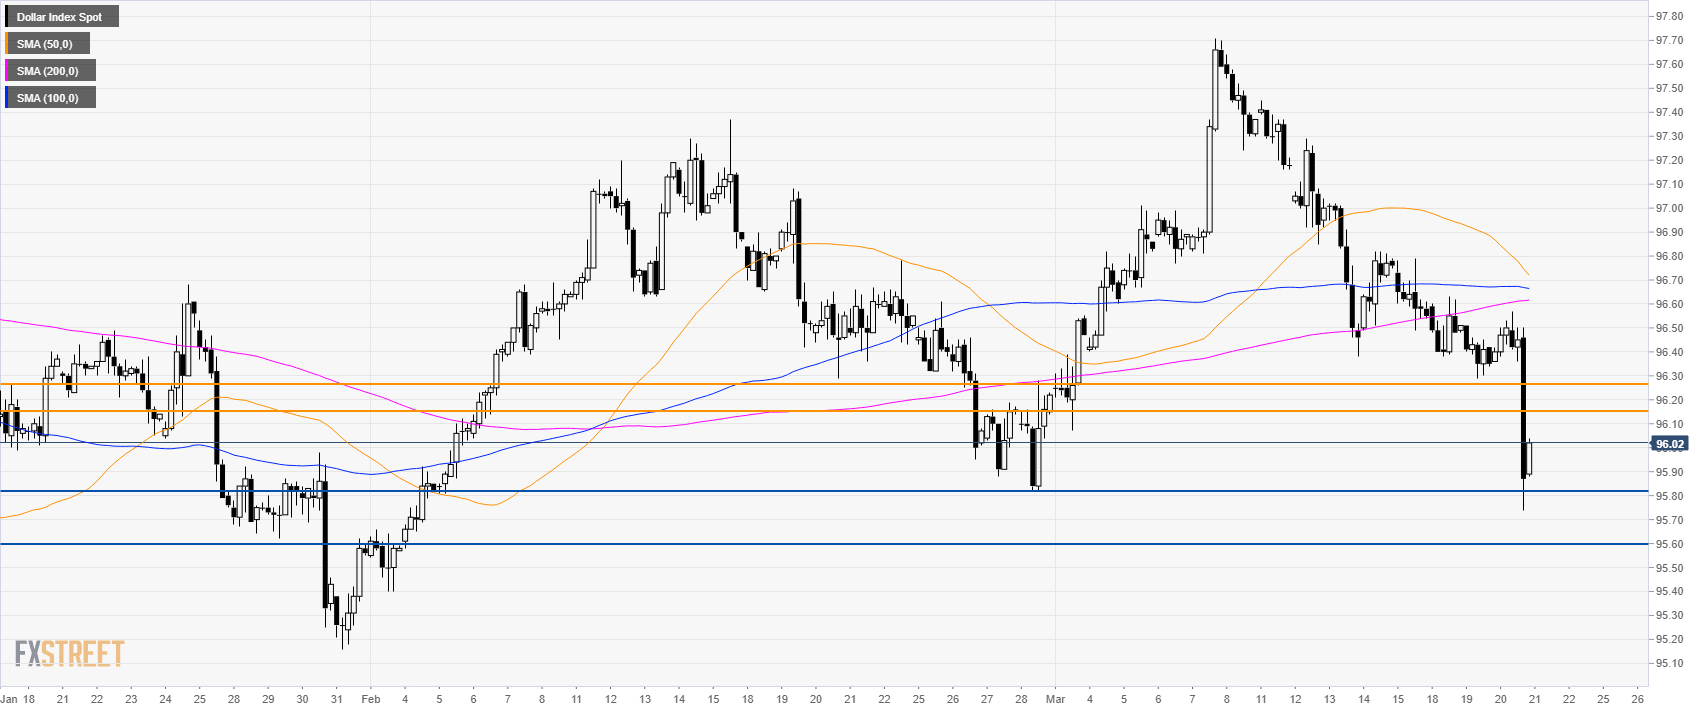
DXY 4-hour chart
- DXY is trading below its main SMAs suggesting bearish momentum in the medium-term.
- The pullback up can find initial resistance at 96.15 and 96.27 level.
- Supports to the downside are at 96.82 and 96.60 level.
Additional key levels
