- The US Dollar Index (DXY) is trading at four-day highs as the recovery is gaining some strength.
- The main resistances on the way up are seen near 97.90 and 98.20 price levels.
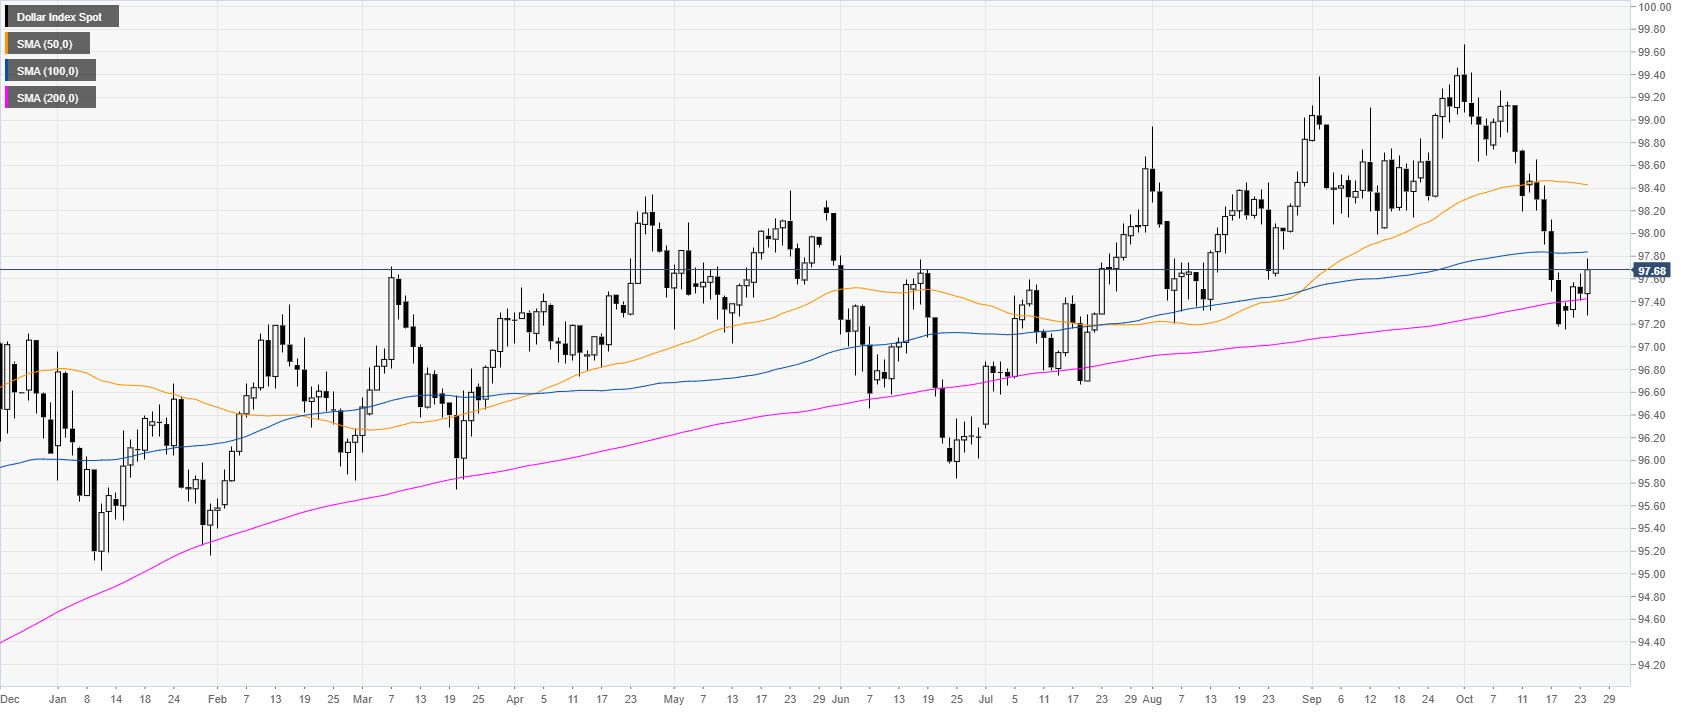
DXY daily chart
The US Dollar Index (DXY) is trading above the 200-day simple moving average (DMA) after a sharp pullback down.
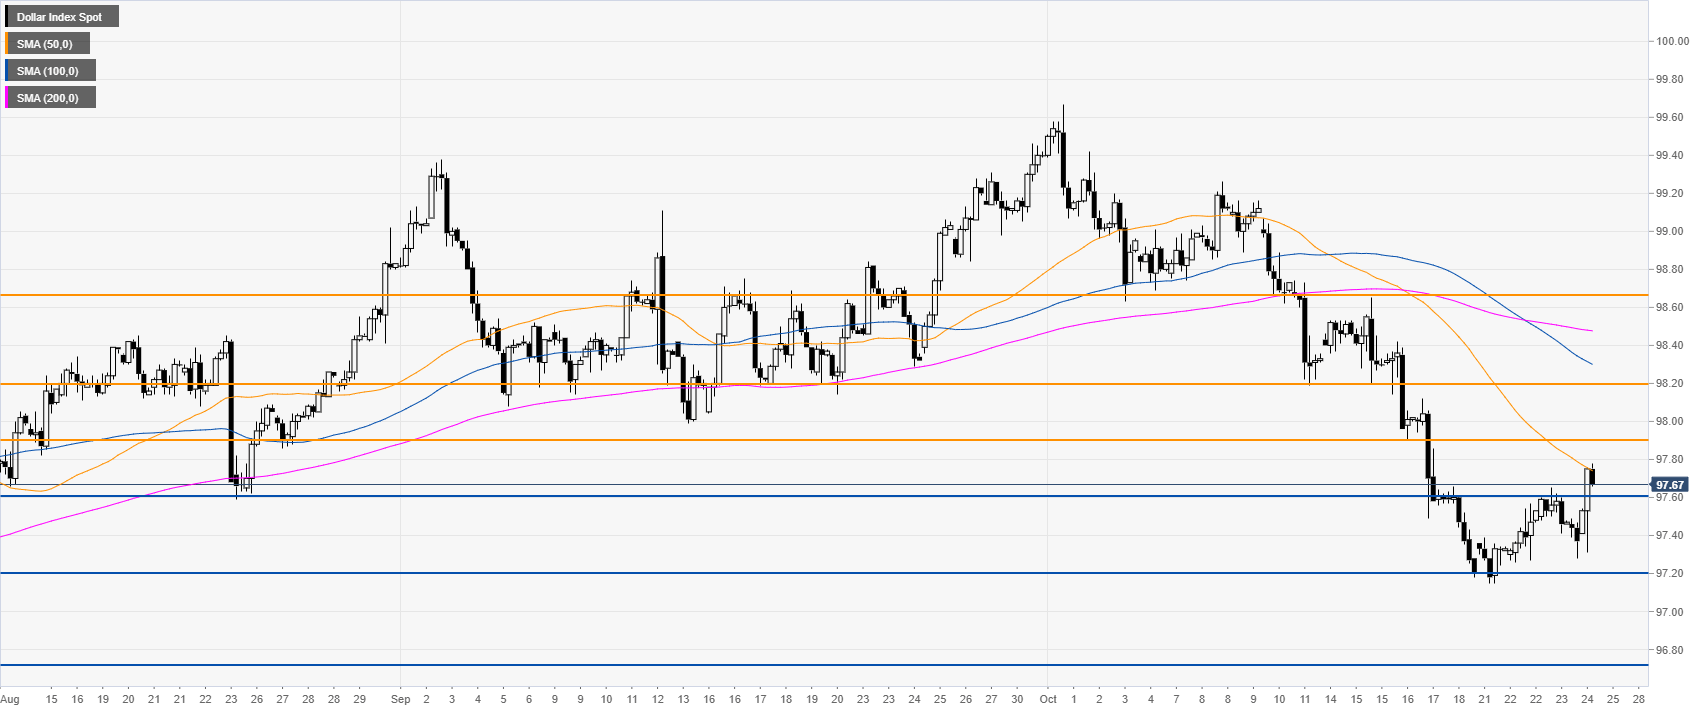
DXY four-hour chart
The market broke above the 97.60 resistance this Thursday and challenged the 50 SMA on the four-hour chart. The recovery is gaining some steam and the next resistances on the way up can be seen near 97.90 and the 98.20 price levels.
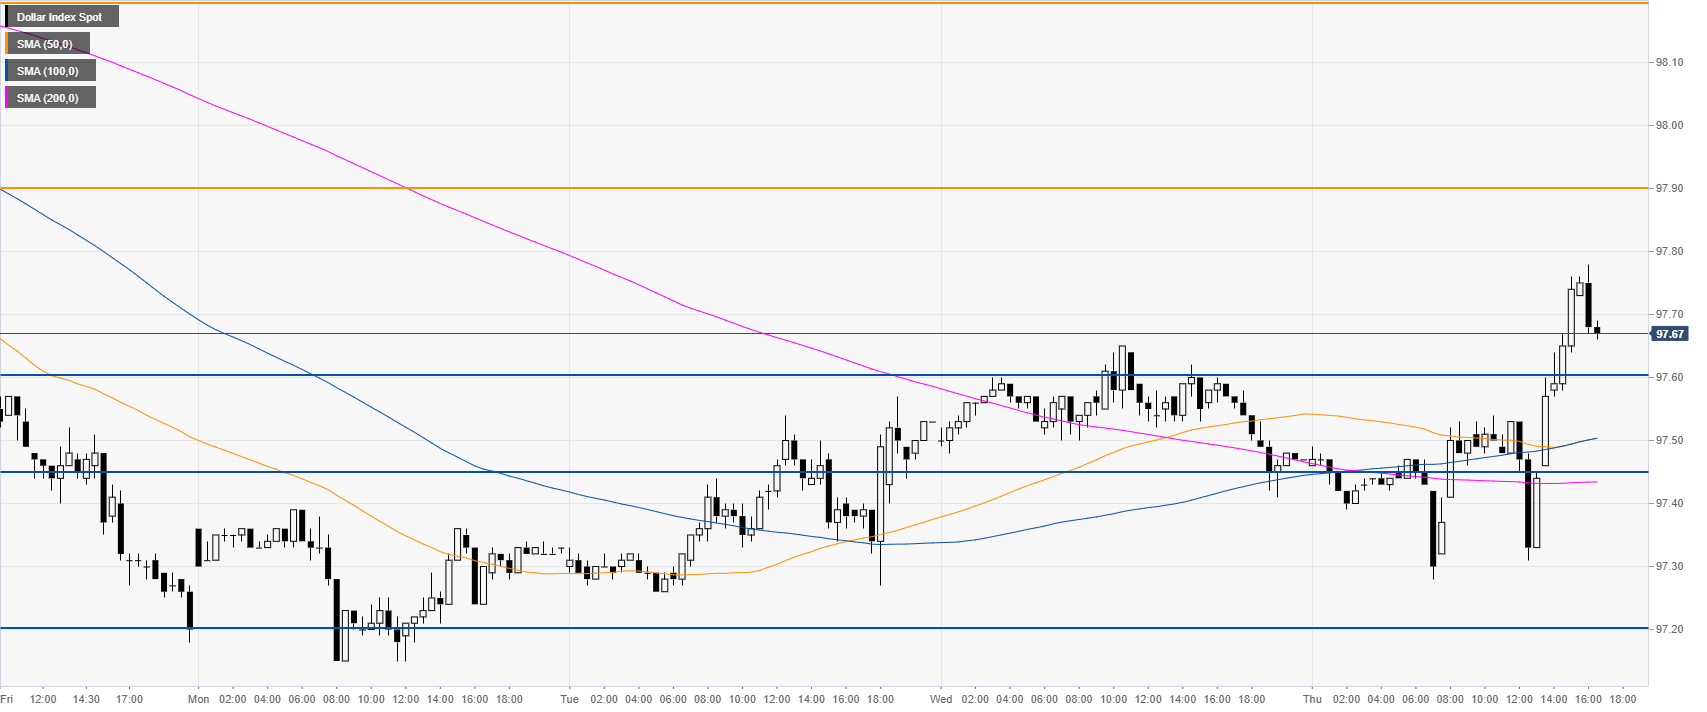
DXY 30-minute chart
DXY is trading above its main SMAs, suggesting a bullish momentum in the short term. Support is seen at the 97.60 and 97.45 level.
Additional key levels
