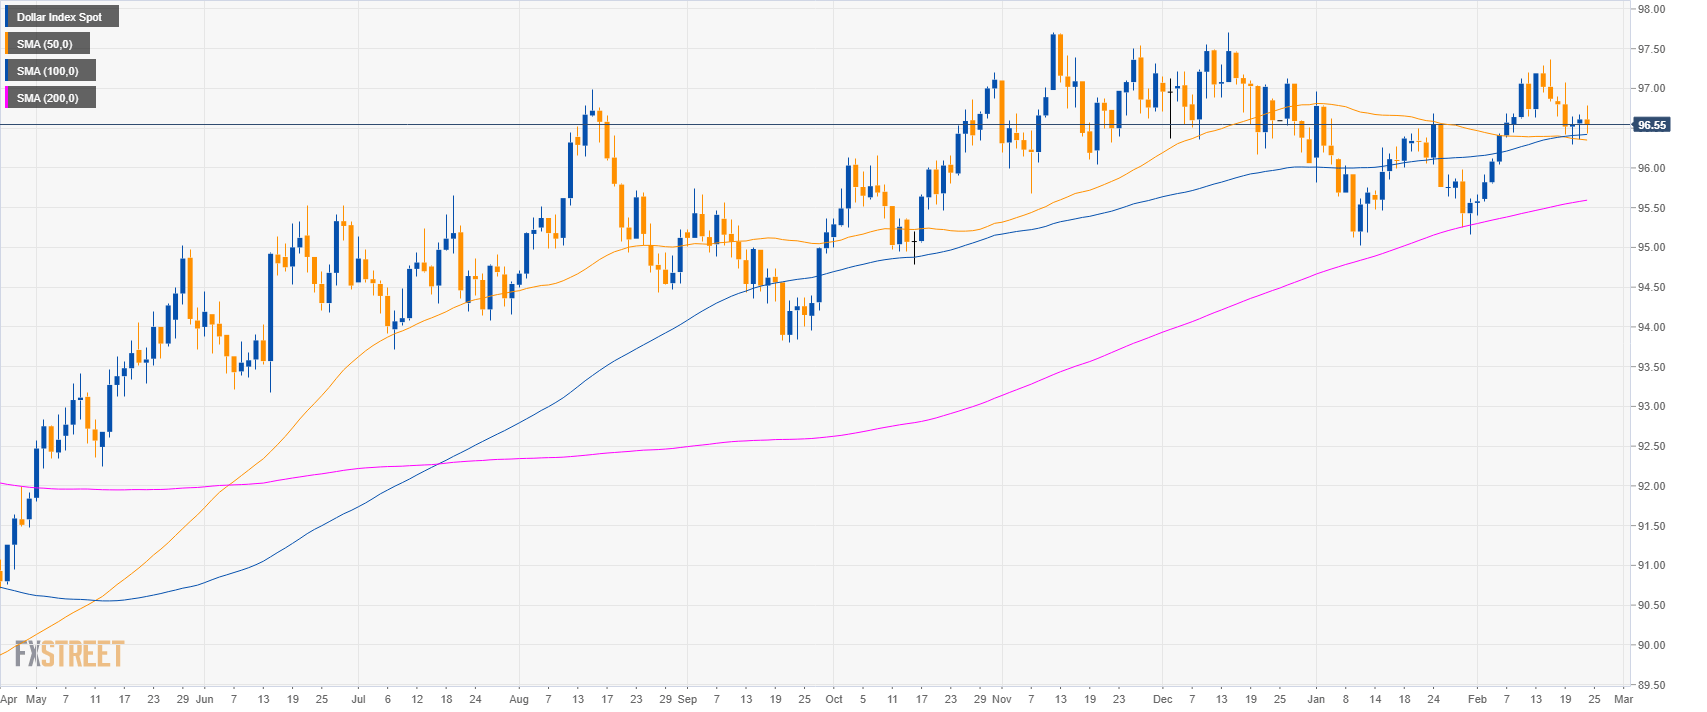
DXY daily chart
- The US Dollar Index (DXY) is trading in a bull trend above its main simple moving averages (SMAs).
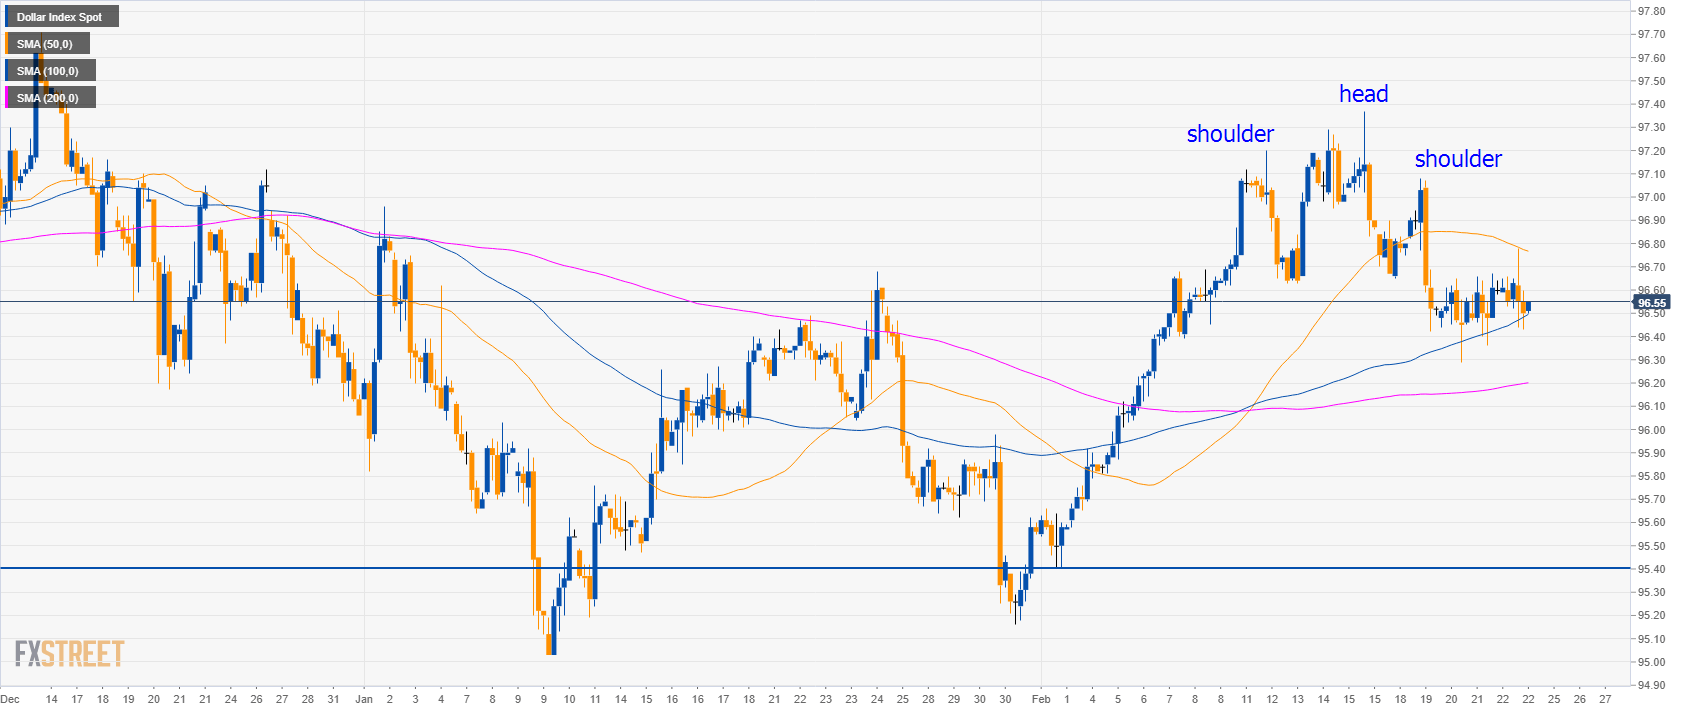
DXY 4-hour chart
- The head-and-shoulders pattern suggests continued weakness ahead with 95.40 as main support.
- Resistances are at 96.70 and 97.10 level.
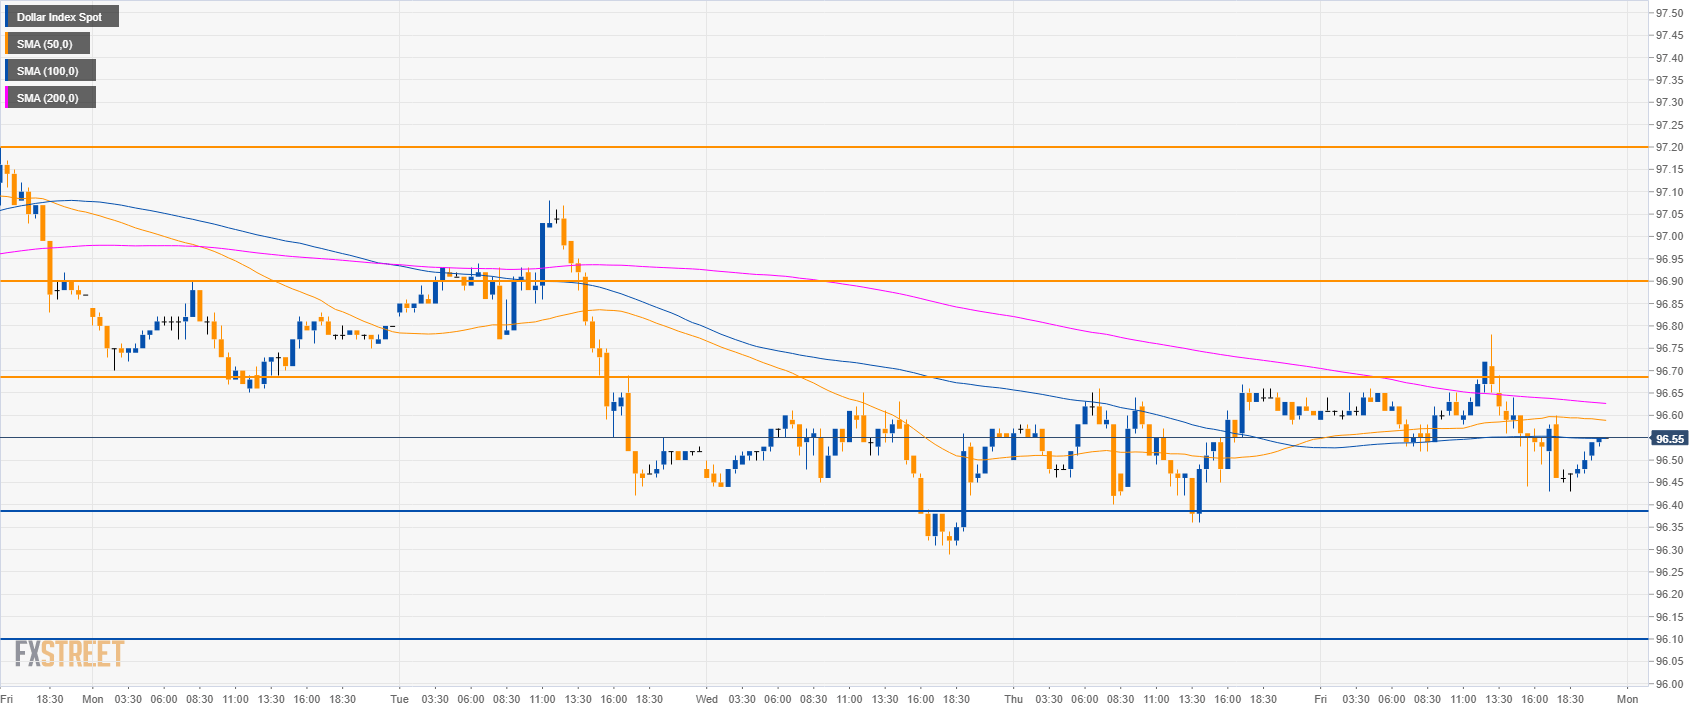
DXY 30-minute chart
- DXY is trading below the main SMAs suggesting a bearish market in the short-term.
- Bears should try to break below 96.40 to get to 96.10, 95.90 and 95.40 to the downside.
- To the upside, resistances are at 96.70 and 96.90 level.
Additional key levels:
Dollar Index Spot
Overview:
Today Last Price: 96.55
Today Daily change: -6 pips
Today Daily change %: -0.06%
Today Daily Open: 96.61
Trends:
Daily SMA20: 96.34
Daily SMA50: 96.36
Daily SMA100: 96.41
Daily SMA200: 95.58
Levels:
Previous Daily High: 96.67
Previous Daily Low: 96.36
Previous Weekly High: 97.37
Previous Weekly Low: 96.62
Previous Monthly High: 96.96
Previous Monthly Low: 95.03
Daily Fibonacci 38.2%: 96.55
Daily Fibonacci 61.8%: 96.48
Daily Pivot Point S1: 96.42
Daily Pivot Point S2: 96.24
Daily Pivot Point S3: 96.11
Daily Pivot Point R1: 96.73
Daily Pivot Point R2: 96.86
Daily Pivot Point R3: 97.04
