- DXY (US Dollar Index) reacted positively after optimistic comments from Fed’s Powell.
- The level to beat for bulls is at 98.42 and 98.68 resistance levels.
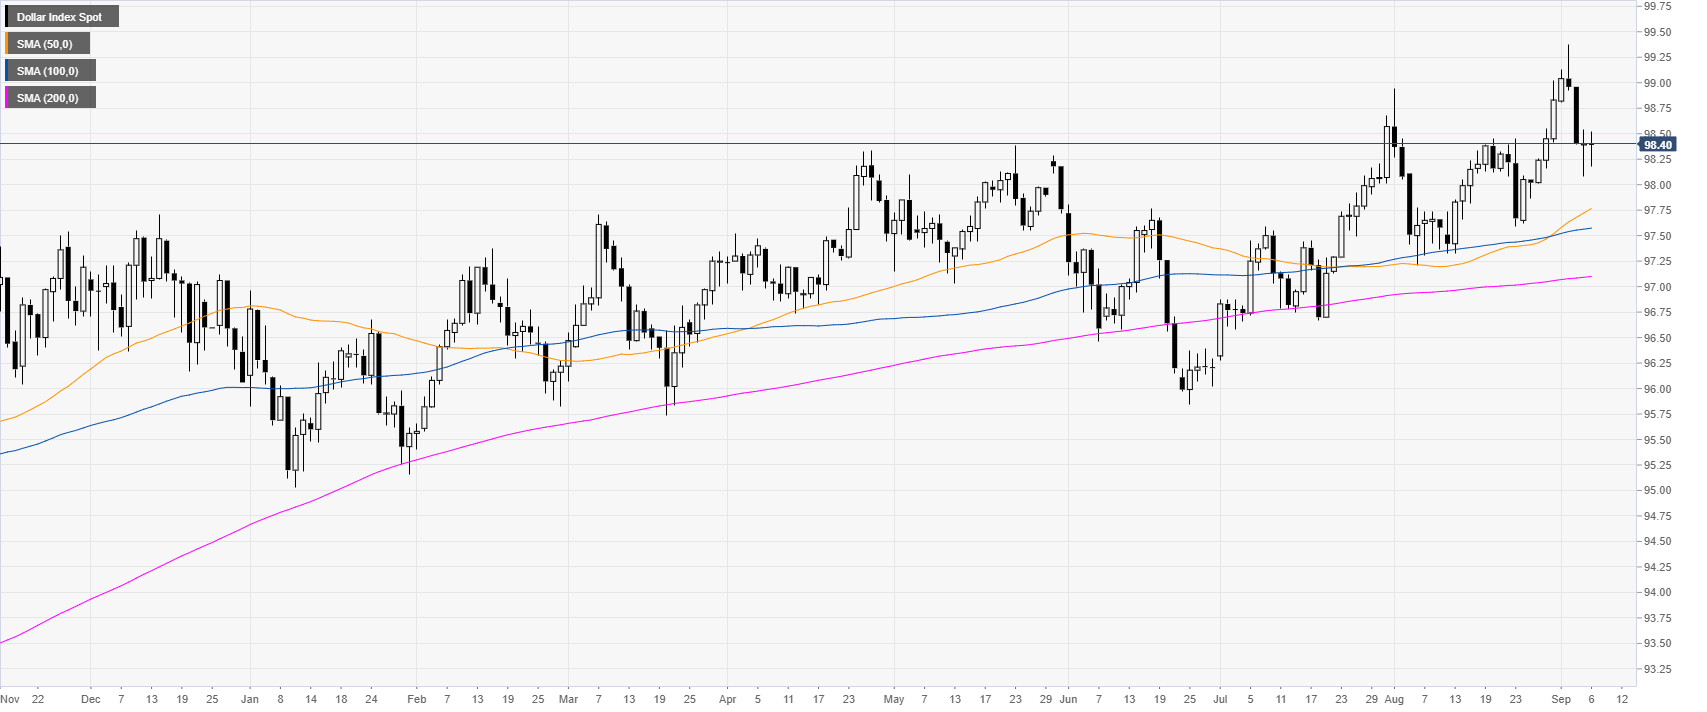
DXY daily chart
DXY (US Dollar Index) is trading in a bull trend above its main daily simple moving averages (DSMAs). DXY is trading mixed after the release of the Non-farm Payrolls (NFP) in the United States (US). The monthly data came in below expectations with only 130K jobs added in August vs. 158K forecast. However, the wages, the Average Hourly Earnings, beat expectations with 3.2% vs. 3.1% forecast. Earlier, FOMC Chairman Jerome Powell said he was not expecting a recession in the US. His optimistic comments triggered some modest strength in the USD.
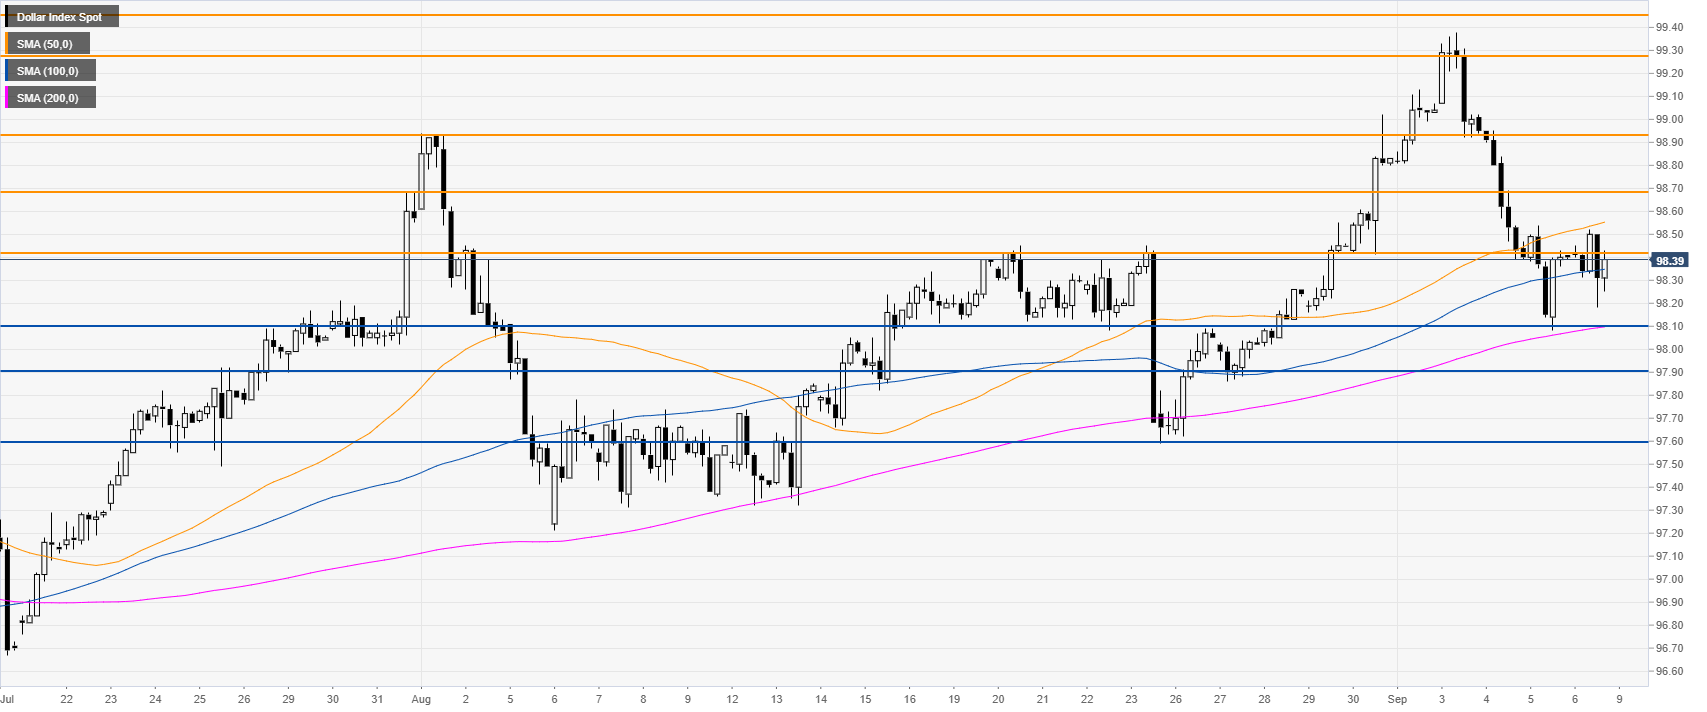
DXY four-hour chart
The Greenback is trading above the 98.0 support and the 100/200 SMAs. DXY bulls need to overcome the 92.42 resistance to reclaim the 98.68 price level in the medium term.
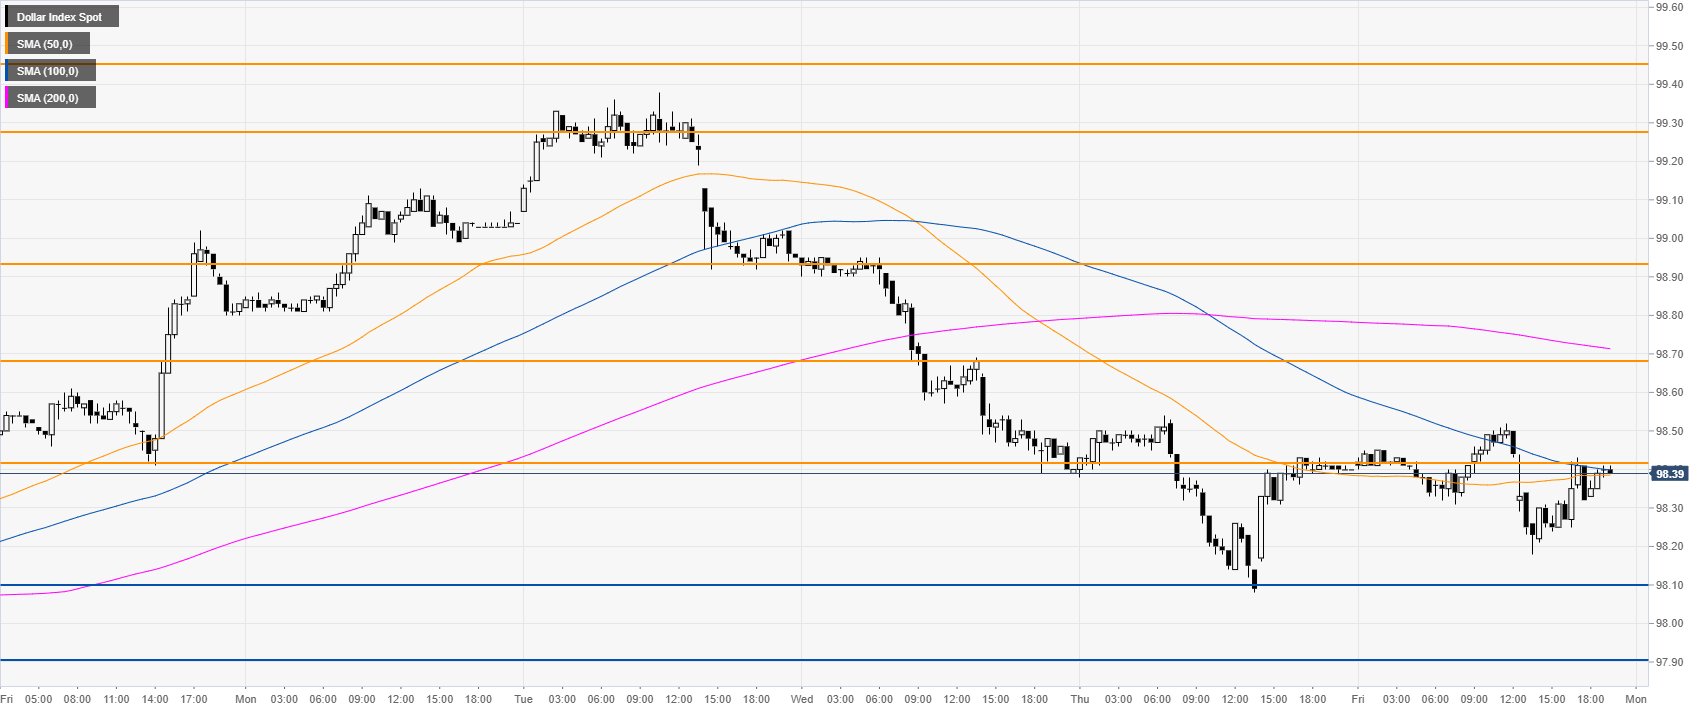
DXY 30-minute chart
DXY is trading below the main SMAs, suggesting bearish momentum in the near term. However, if the market holds above 98.10 it would be seen as a sign of bullish strength. The next support is seen at 97.90 price level.
Additional key levels
