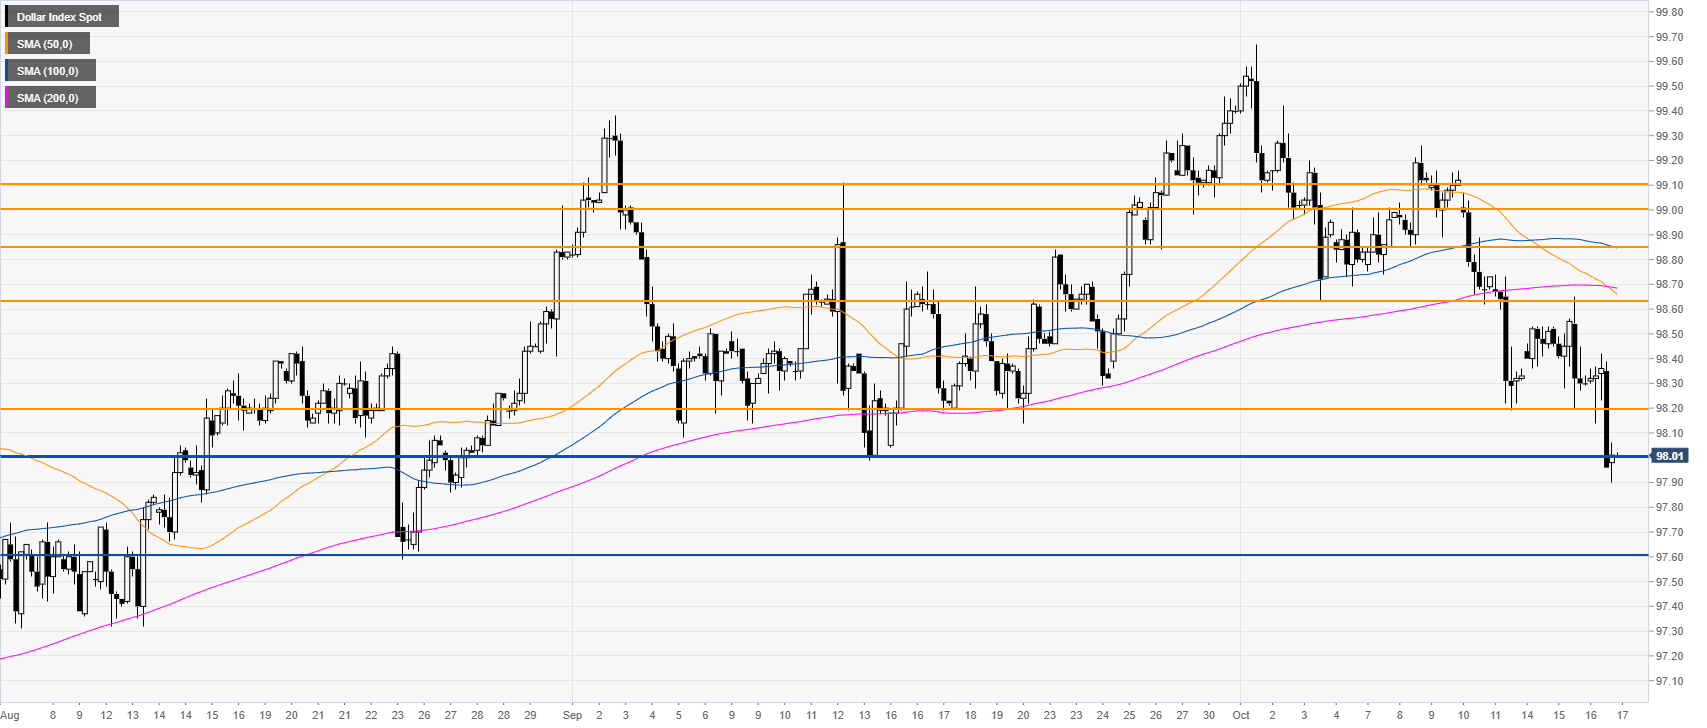
- DXY is under bearish pressure as the market is challenging the September lows.
- DXY is approaching the 100-day simple moving average today at 97.84.
DXY daily chart
The US Dollar Index (DXY) is trading in a bull trend above the 100 and 200-day simple moving averages (DSMAs). This Wednesday the Greenback declined to the 98.00 handle, trading just above the 100 SMA. On the macroeconomic front, the Retail Sales Control Group in the United States disappointed coming out at 0% vs 0.3% in September, exacerbating the already negative sentiment on the US Dollar.
DXY four-hour chart
DXY is under bearish pressure below the main SMAs. The market had another leg down to the 98.00 handle and the September lows. If the bears keep the pressure on the market might reach the 97.60 swing low.
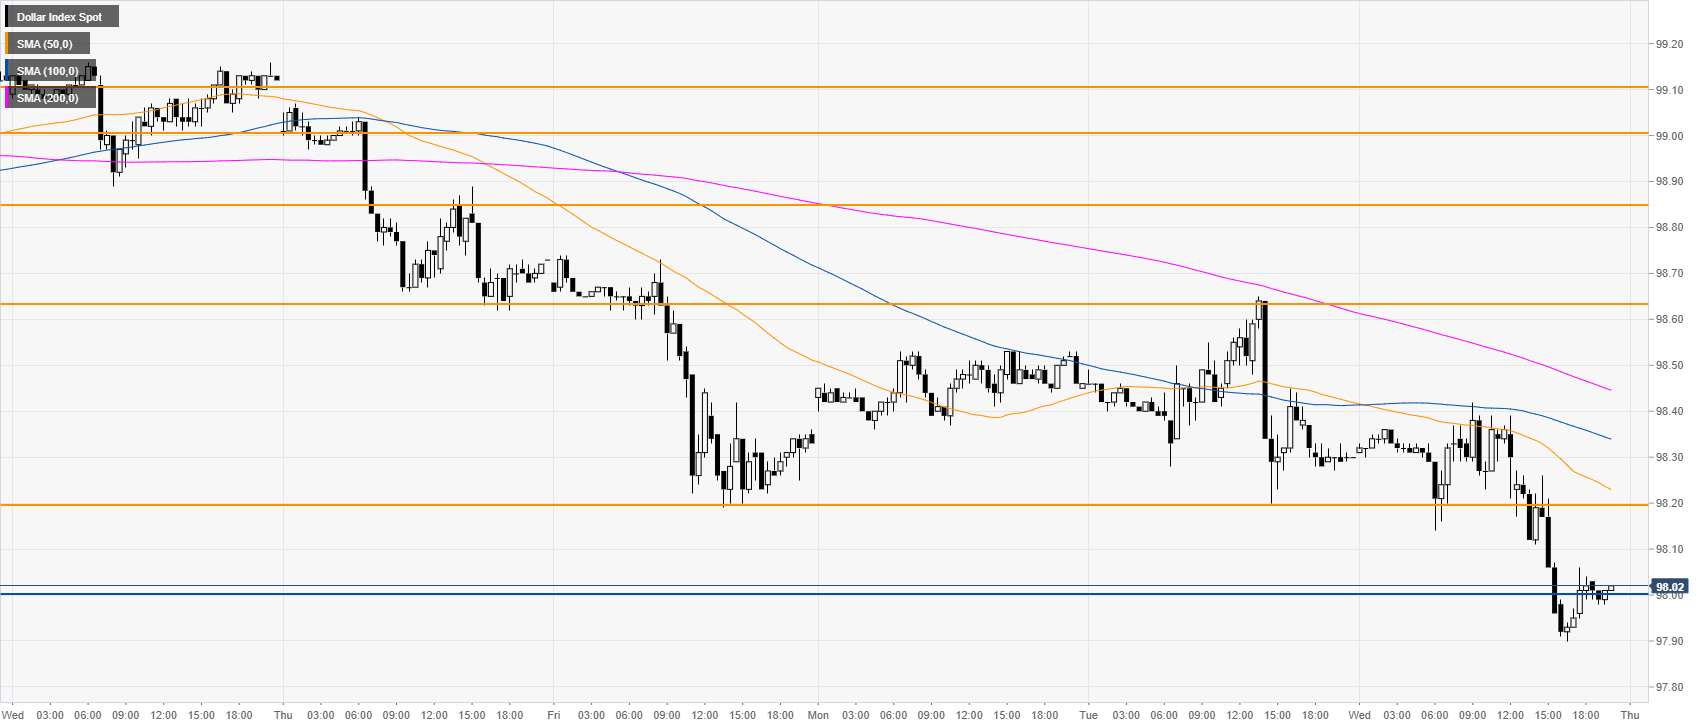
DXY 30-minute chart
DXY is trading below the main SMAs, suggesting a bearish bias in the short term. Resistances are seen at the 98.20 and 98.63 levels. Bulls would need to have a daily close above the 98.63 resistance to alleviate the current bearish pressure.
Additional key levels


