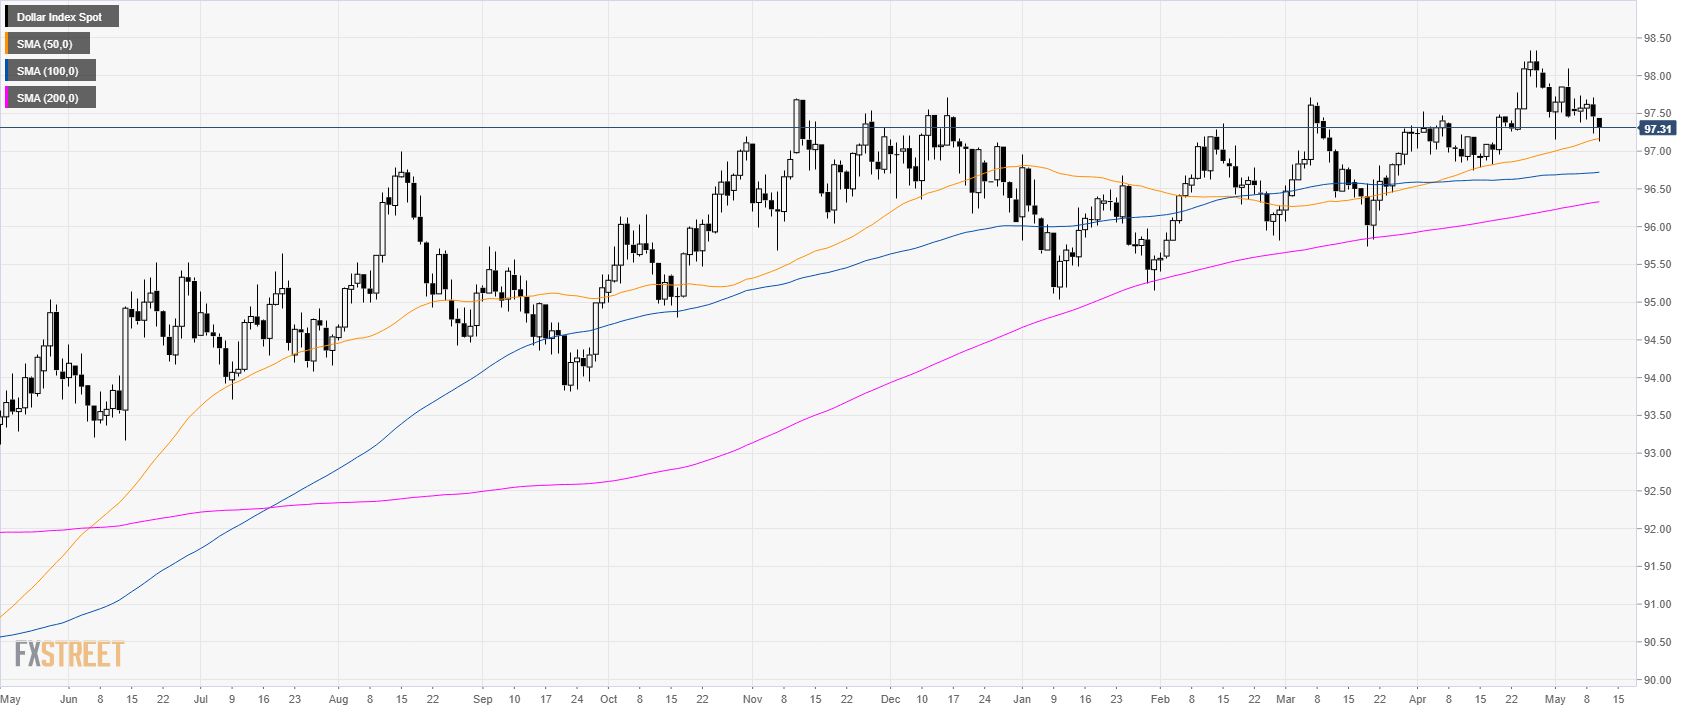
DXY daily chart
The US Dollar Index (DXY) is trading in a bull trend above its main simple moving averages (SMAs).
This Friday DXY declined slightly and found some support at the 50 SMA.
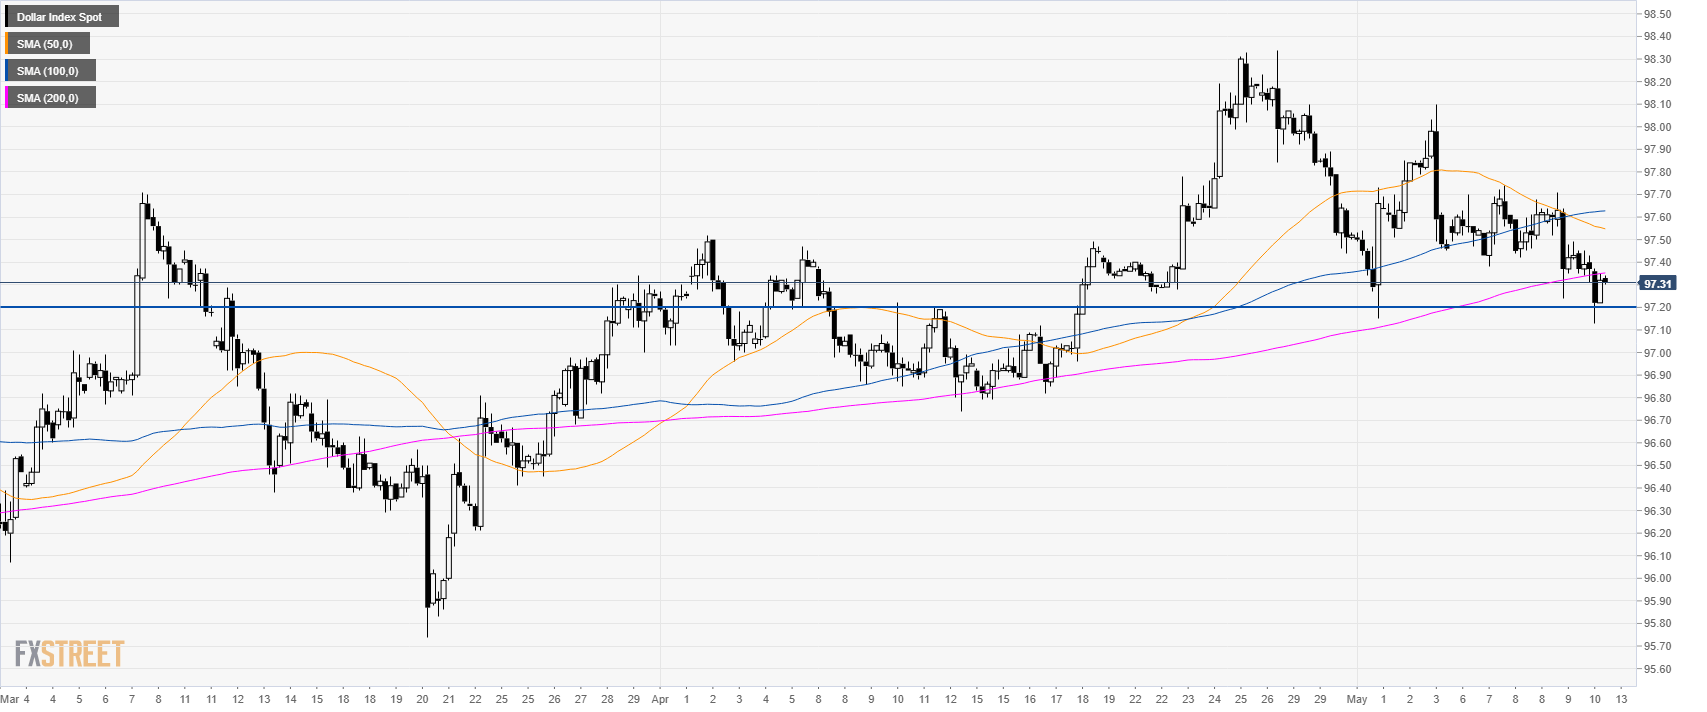
DXY 4-hour chart
DXY trades above 97.20 key support.
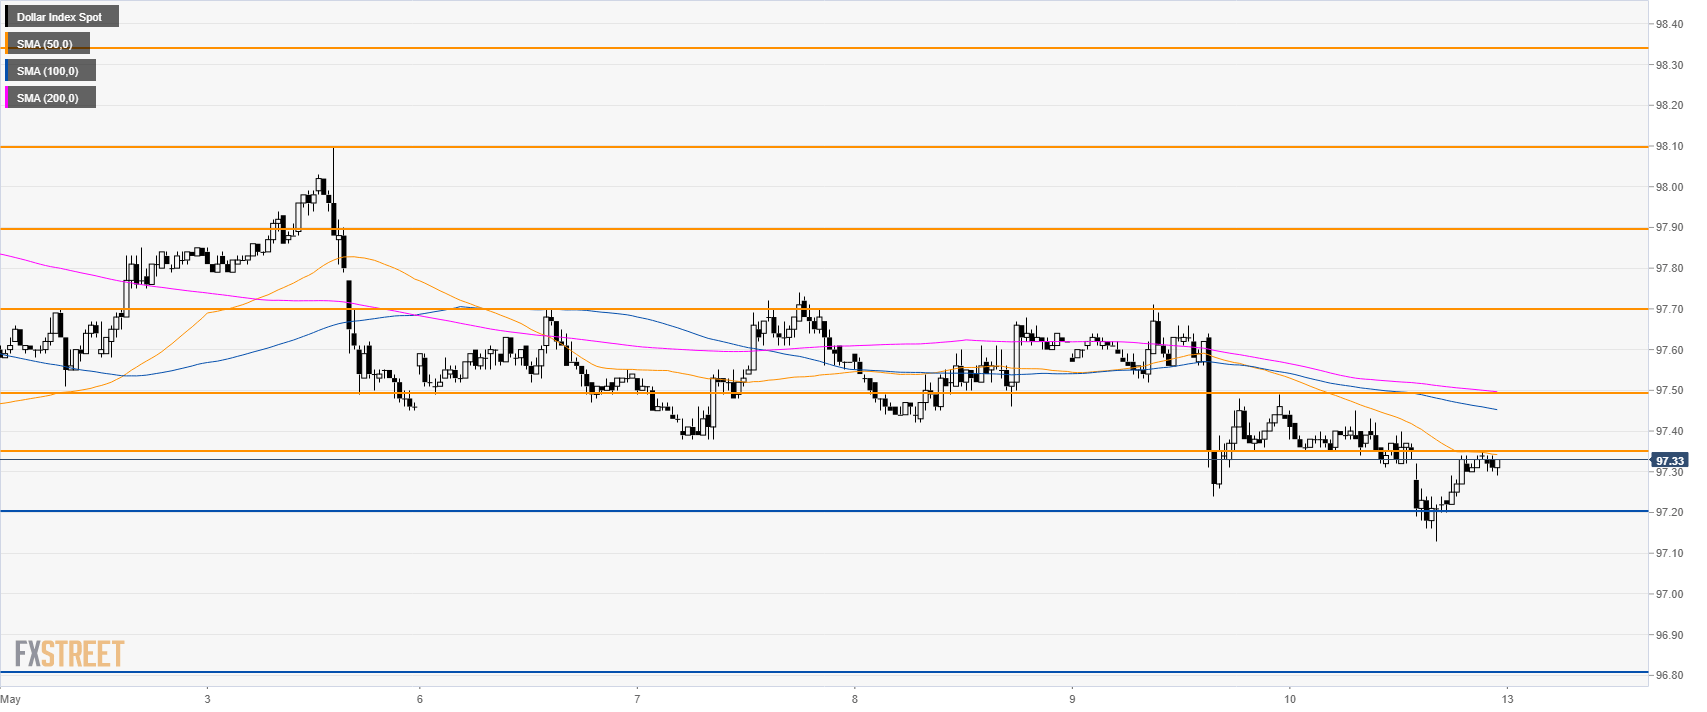
DXY 30-minute chart
DXY is trading below its main SMAs suggesting a bearish bias in the short-term.
However, the main trend is up and a bullish break above 97.35 can see a move towards 97.50, 97.70 and 97.90 level.
Support is seen at 97.35 and 97.20 level.
Additional key levels
