- DXY this week started to correct the early November advance.
- The next key supports are seen at the 97.80 and 97.50 levels.
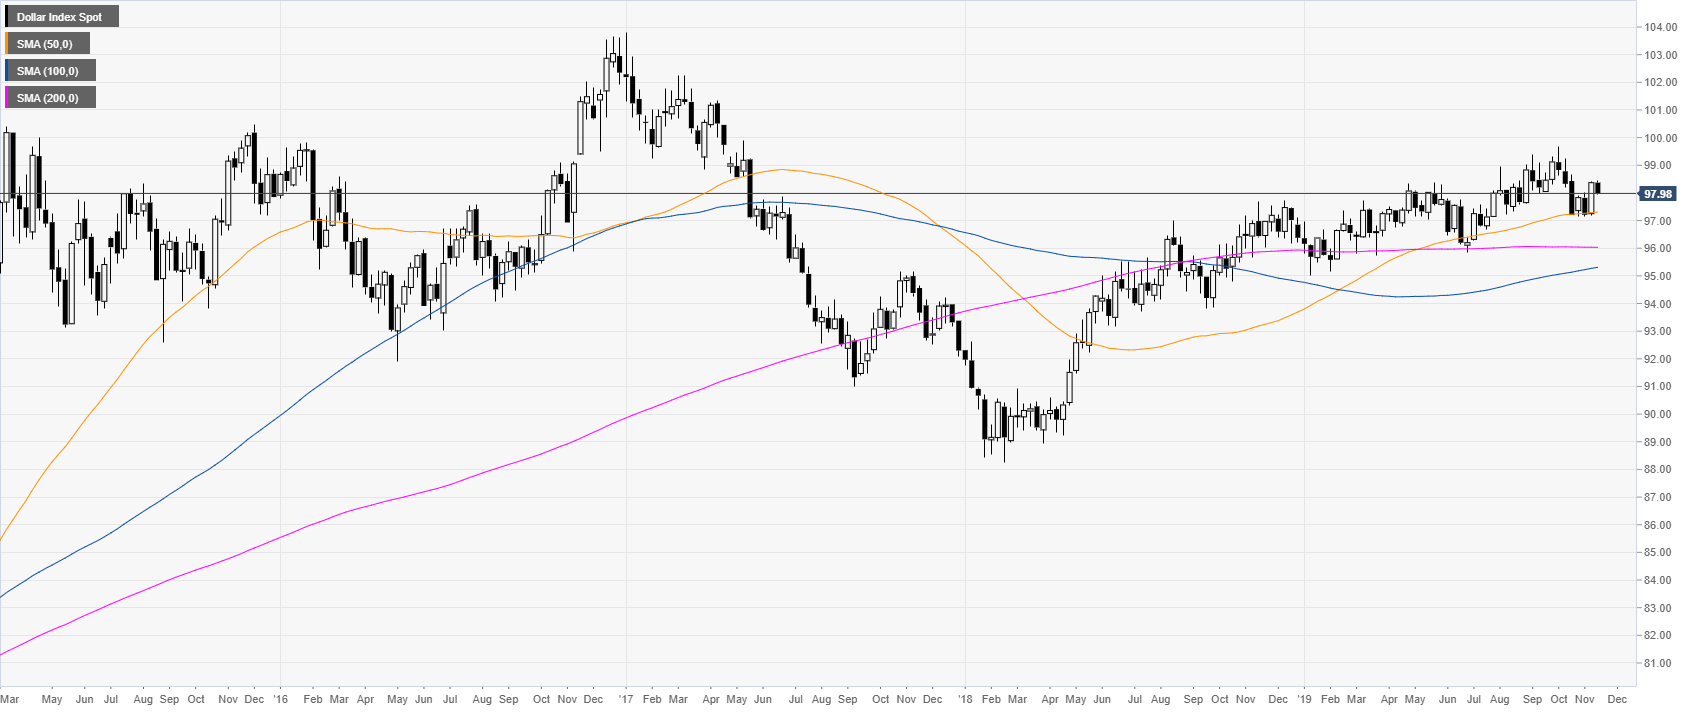
DXY weekly chart
DXY (US Dollar Index) retreated slightly this week as the Index is trading above its main weekly simple moving averages in a bull channel.
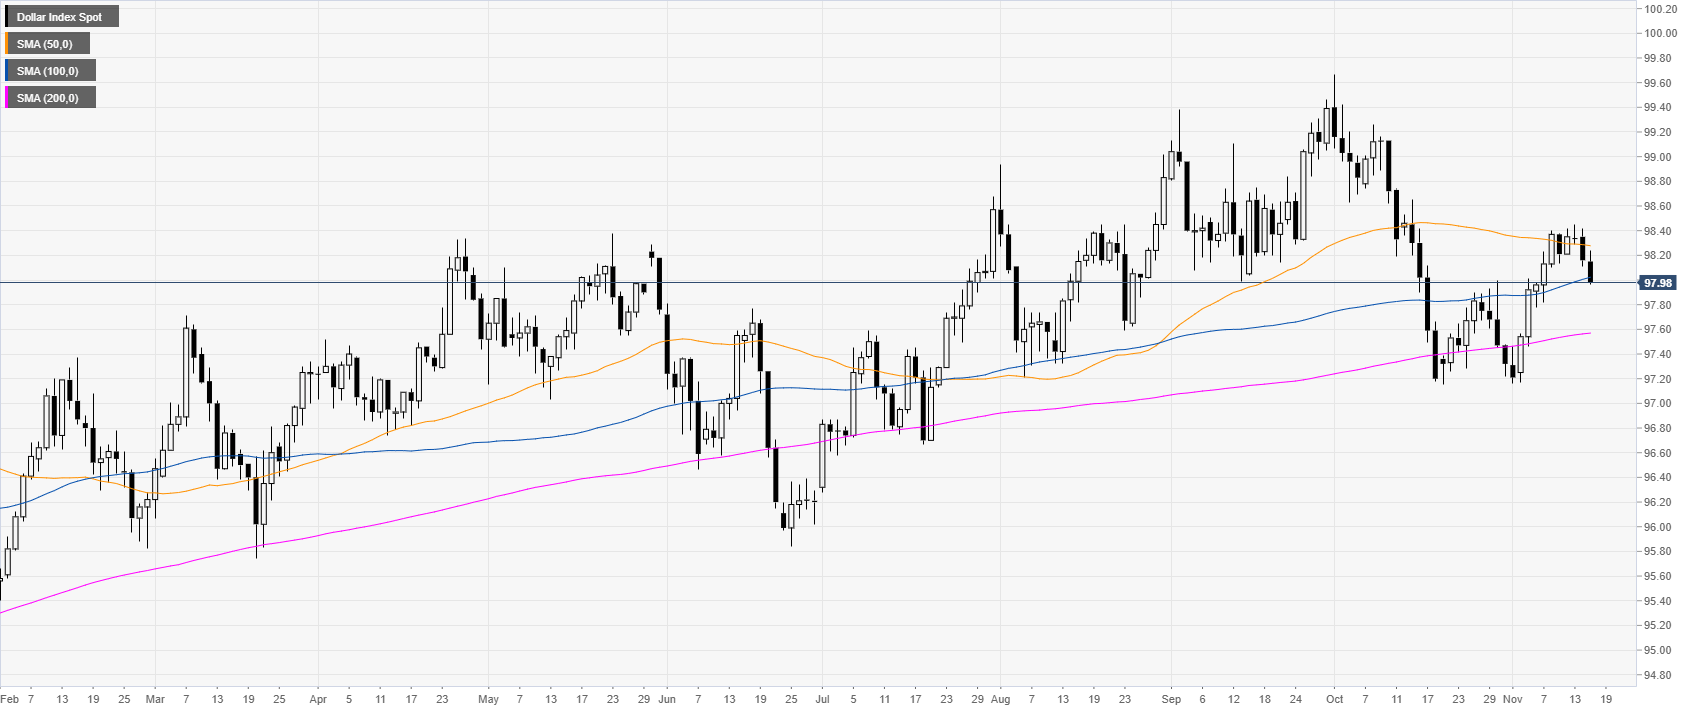
DXY daily chart
DXY (US Dollar Index) is trading in a bull trend above the 200-day simple moving average (DMA). This Friday the buck dropped to its lowest in five-days near the 100 DMA located at 98.02.
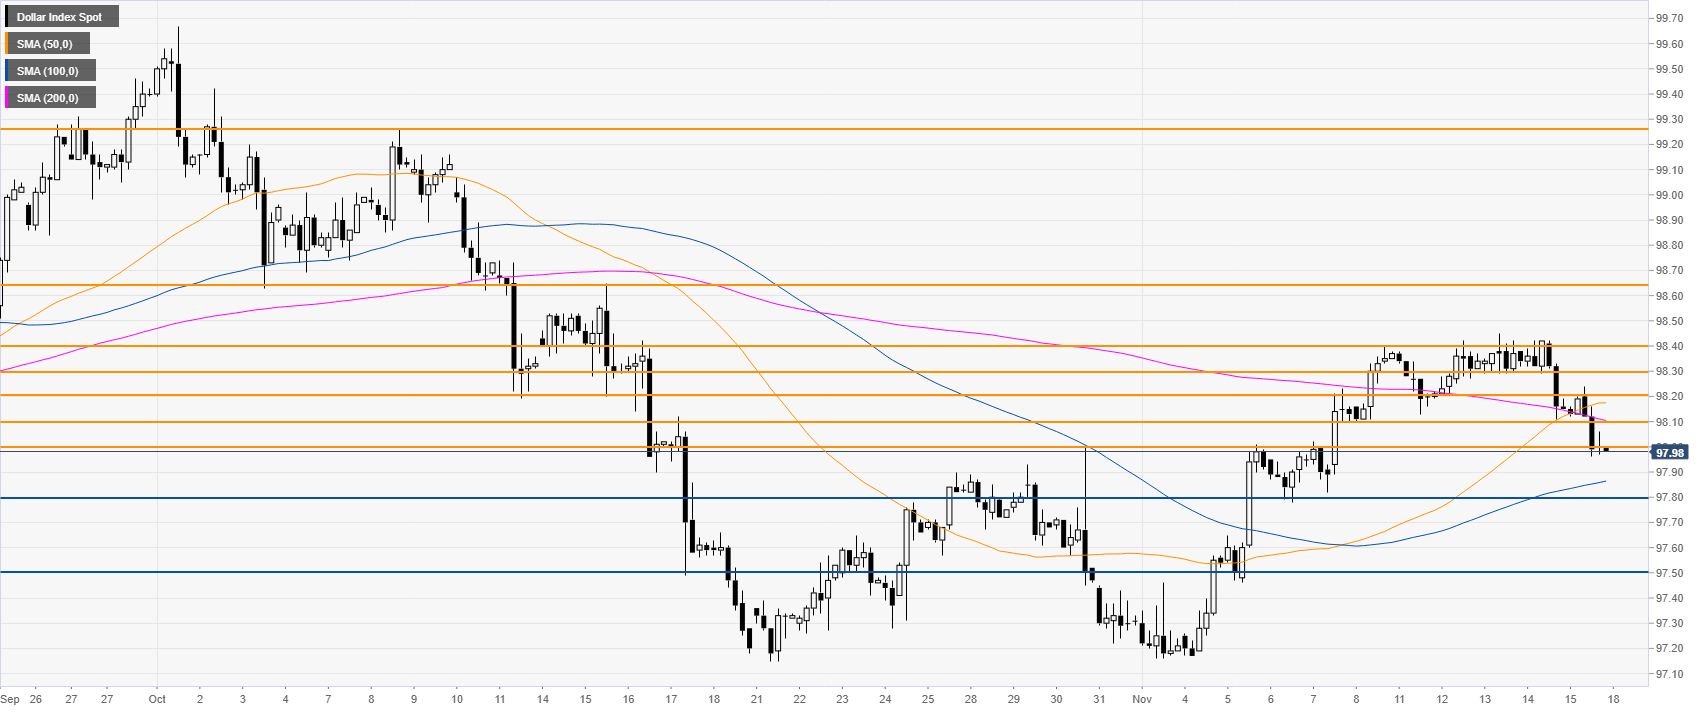
DXY 4-hour chart
DXY is correcting down below its 50 and 200 SMAs, suggesting a bearish bias in the medium term. The market is trying to break below the 98.00 handle. Next week if there is bearish follow-through, the market might continue to decline towards the 97.80 support level. If that support fails to hold prices, then 97.50 can be on the cards.
Additional key levels
