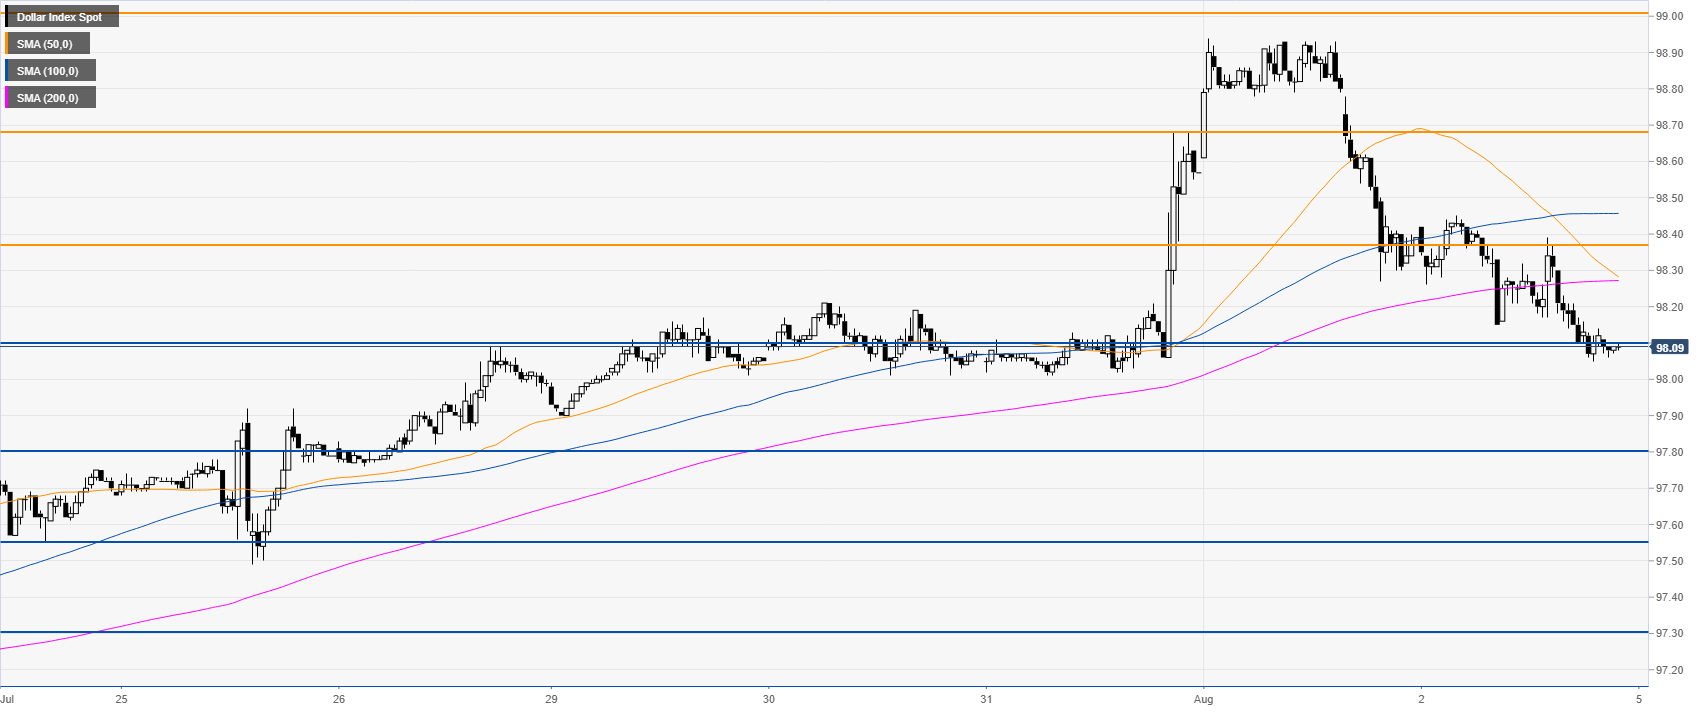
- DXY retraces down from the 2019 high as the Federal Reserve might cut rates in September.
- The level to beat for bears are seen at 98.10, followed by 97.80 and 97.55 supports.
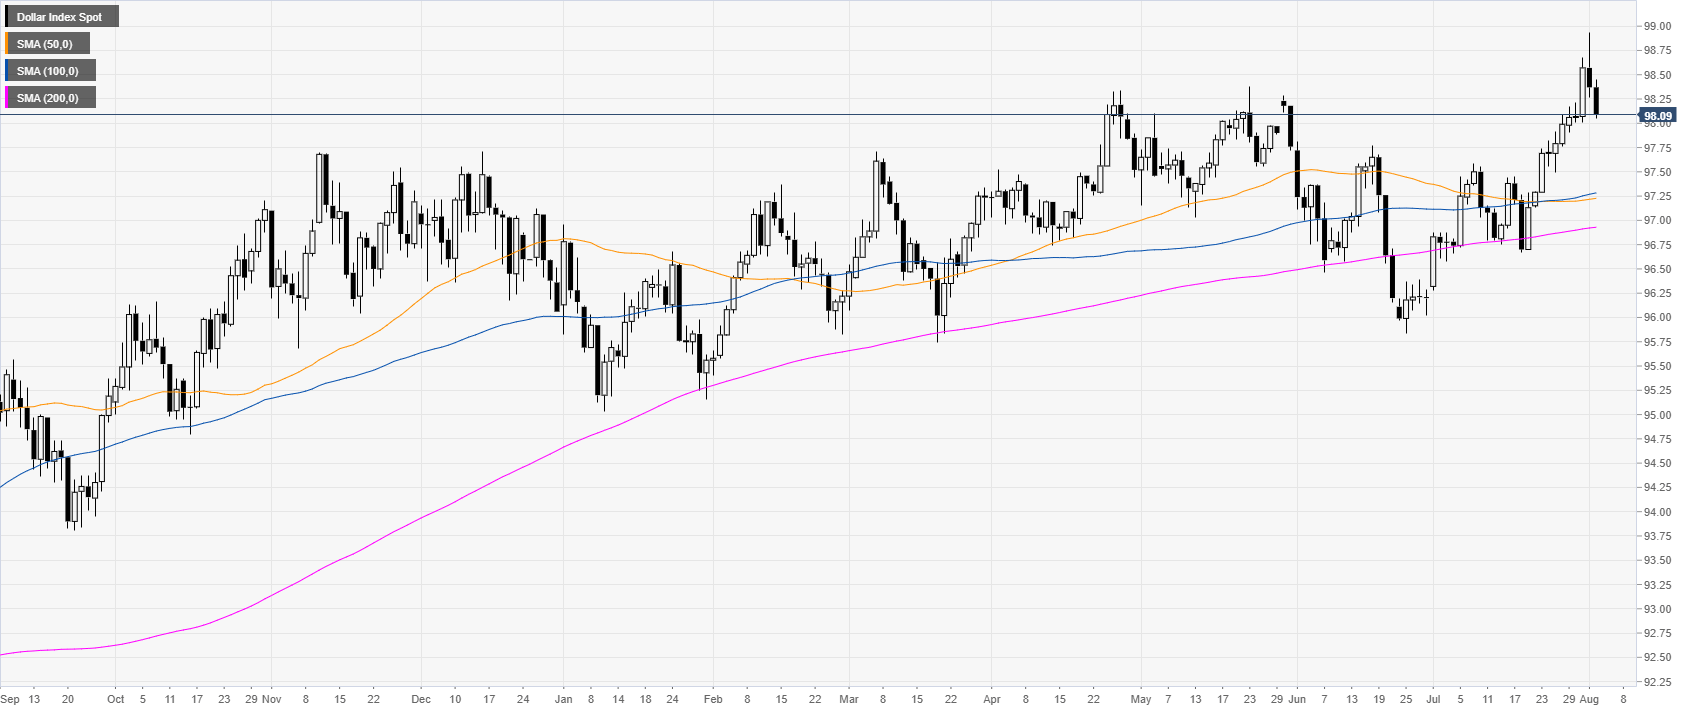
DXY daily chart
DXY (US Dollar Index) is trading in a bull trend above its main daily simple moving averages (DSMAs). However, the greenback is currently retracing down from the 2019 highs. The market is speculating that there will be another 25bps interest rate cut this September.
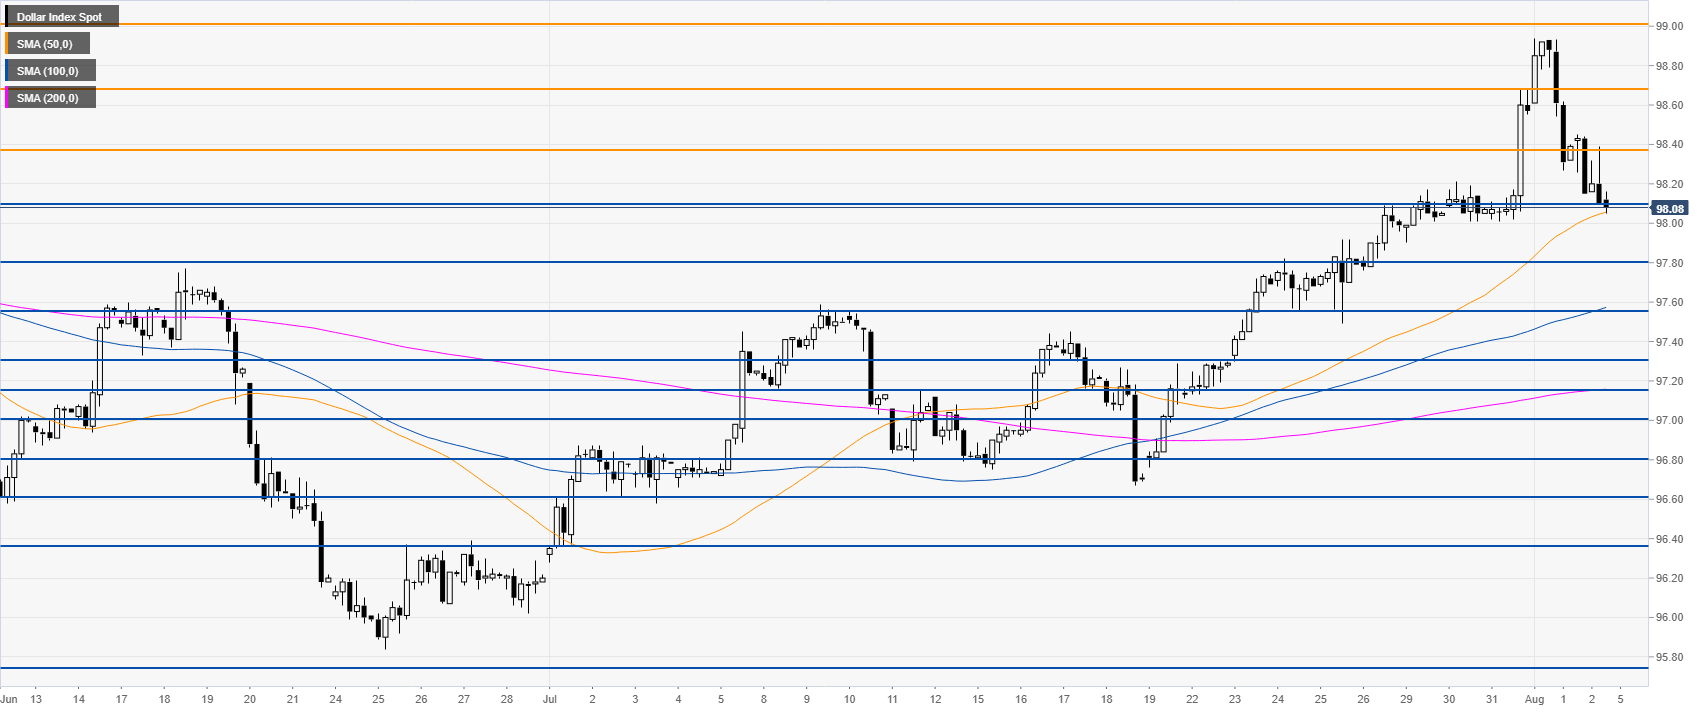
DXY 4-hour chart
DXY is testing 98.10 support and the 50 SMA. The bulls would need to reclaim 98.38 and 98.68 resistance in order to resume the bull trend.
DXY 30-minute chart
DXY is trading below its main SMAs, suggesting bearish momentum in the near term. A break below 98.10 support should lead to 97.80 and the 97.55 level on the way down.
Additional key levels
