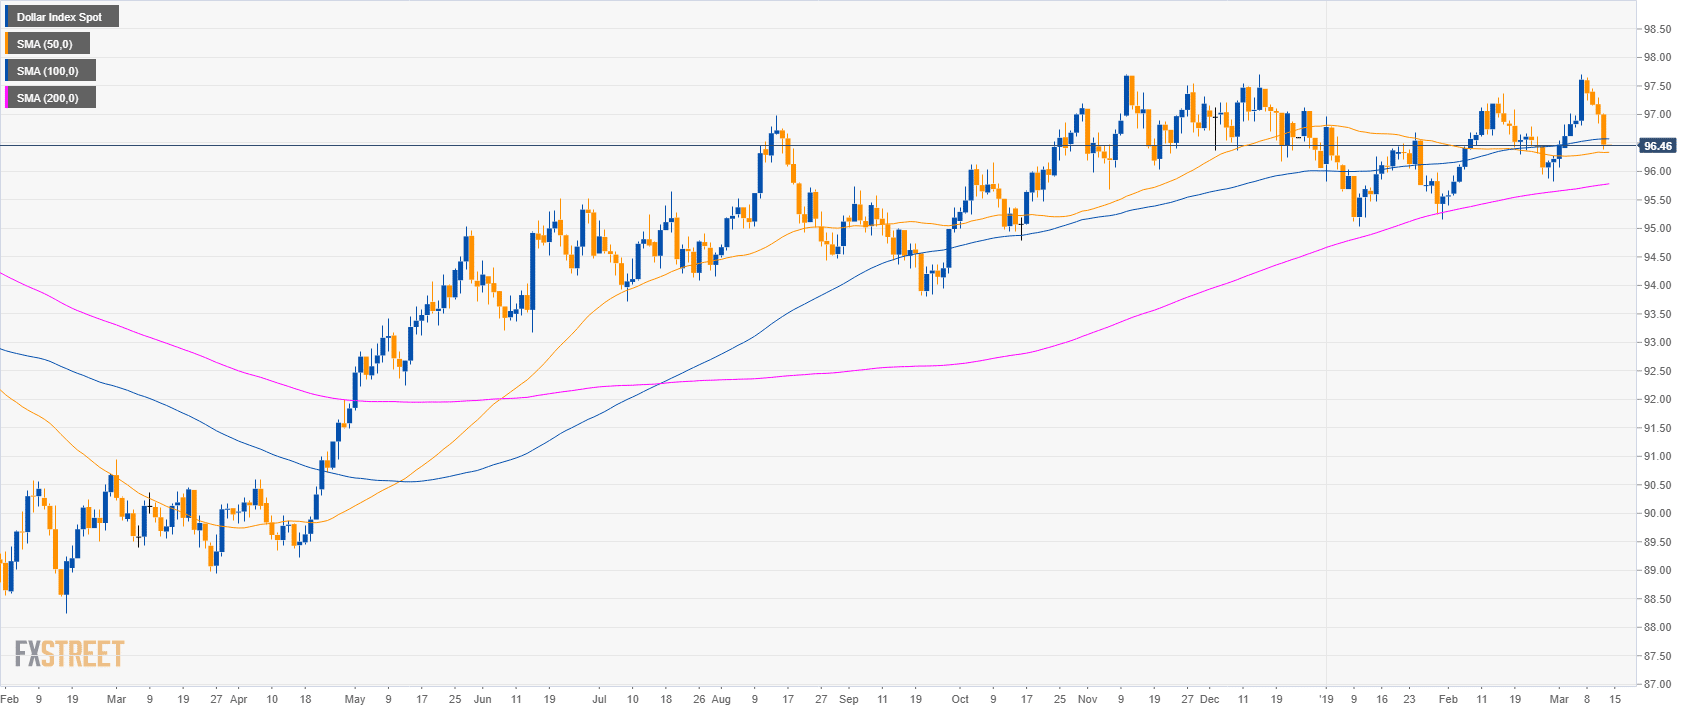
DXY daily chart
- The US Dollar Index (DXY) is trading in a bull trend above its 200-day simple moving average.
DXY 4-hour chart
- DXY is trading below its main SMAs suggesting bearish momentum in the medium-term.
- A break below 96.40 should open the doors to 96.00 the figure.
- Resistances are at 96.90 and 97.40 level.

Additional key levels
Dollar Index Spot
Overview:
Today Last Price: 96.46
Today Daily change: -54 ticks
Today Daily change %: -0.56%
Today Daily Open: 97
Trends:
Daily SMA20: 96.75
Daily SMA50: 96.34
Daily SMA100: 96.57
Daily SMA200: 95.76
Levels:
Previous Daily High: 97.29
Previous Daily Low: 96.85
Previous Weekly High: 97.71
Previous Weekly Low: 96.4
Previous Monthly High: 97.37
Previous Monthly Low: 95.4
Daily Fibonacci 38.2%: 97.02
Daily Fibonacci 61.8%: 97.12
Daily Pivot Point S1: 96.8
Daily Pivot Point S2: 96.61
Daily Pivot Point S3: 96.36
Daily Pivot Point R1: 97.24
Daily Pivot Point R2: 97.49
Daily Pivot Point R3: 97.68
