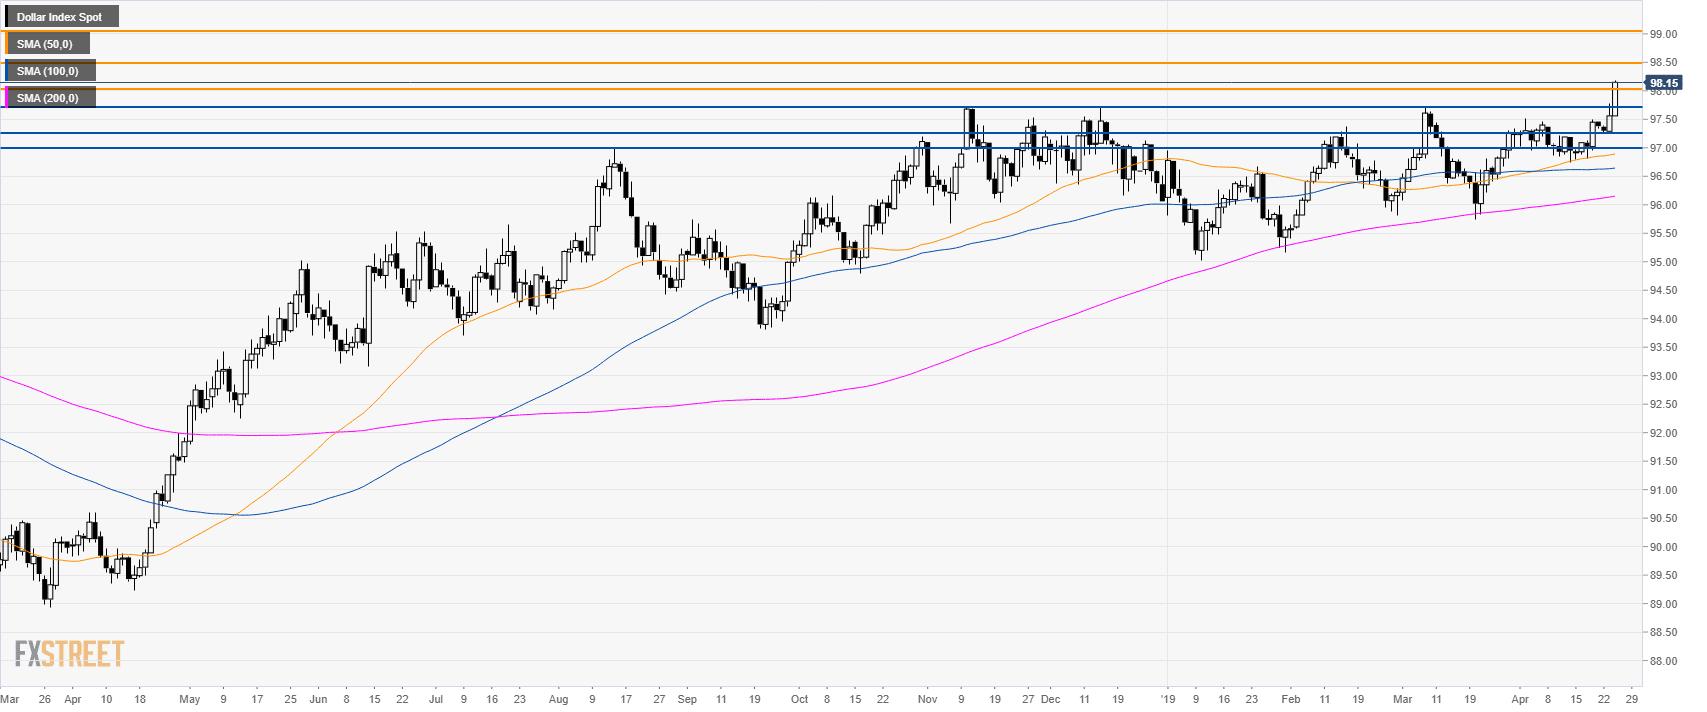
DXY daily chart
- The US Dollar Index (DXY) is trading in a bull trend above its 200-day simple moving average (SMA).
- DXY is beaking multi-month’s resistance at 97.71 level.
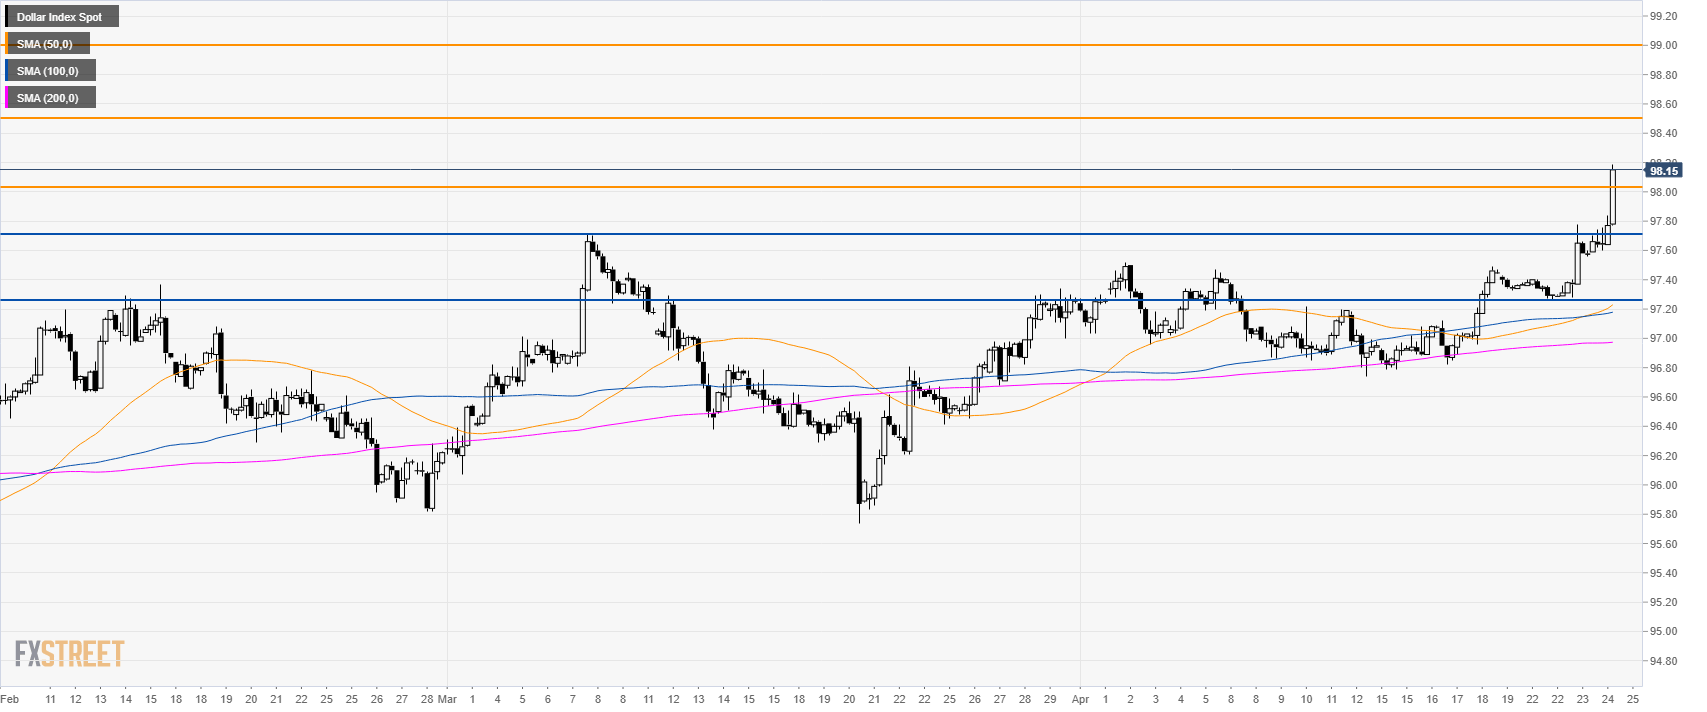
DXY 4-hour chart
- The break above 98.00 the figure is significant as it opens the gates to further upside towards 98.50 and 99.00 level.
- To the downside, support is seen at 97.71 and 97.26.
Additional key levels
