- The Greenback is ending Tuesday near its lows as the Greenback is on a rollercoaster.
- Investors will be watching for clues on the FOMC this Wednesday.
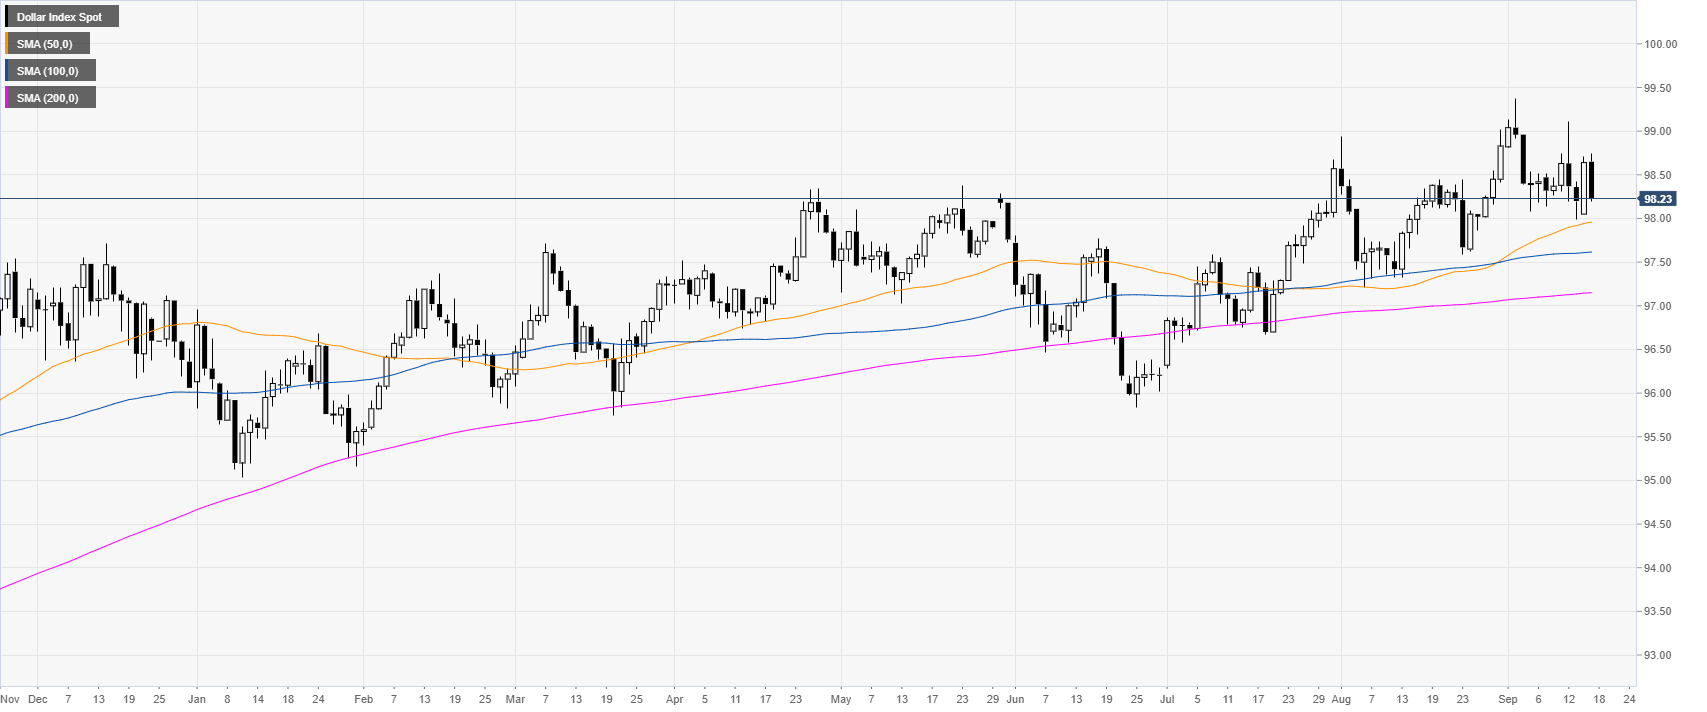
DXY daily chart
DXY (US Dollar Index) is trading in a bull trend above the main daily simple moving averages (DSMAs). The Greenback has been quite choppy in the last two weeks. Investors will be taking their cues this Wednesday with the FOMC.
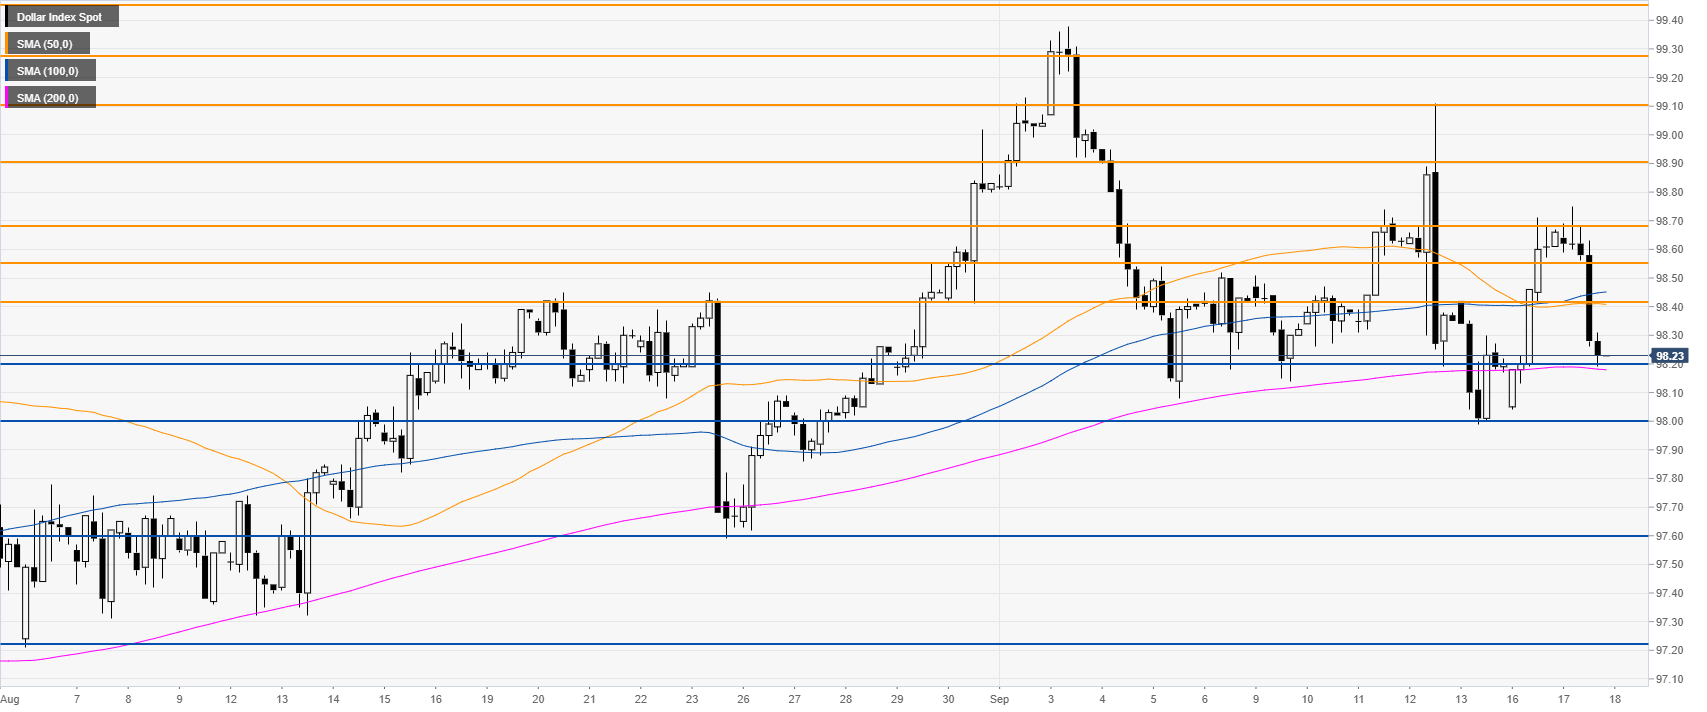
DXY four-hour chart
DXY is trading below the 50/100 SMAs, suggesting a consolidation in the medium term. The market is ending the day just above the 98.20 support and the 200 SMA. However, DXY is looking for a clear direction as investors are stirring the Greenback back and forth. If bears overcome the 98.20 support, the market can decline towards the 97.60 and 97.20 swing lows.
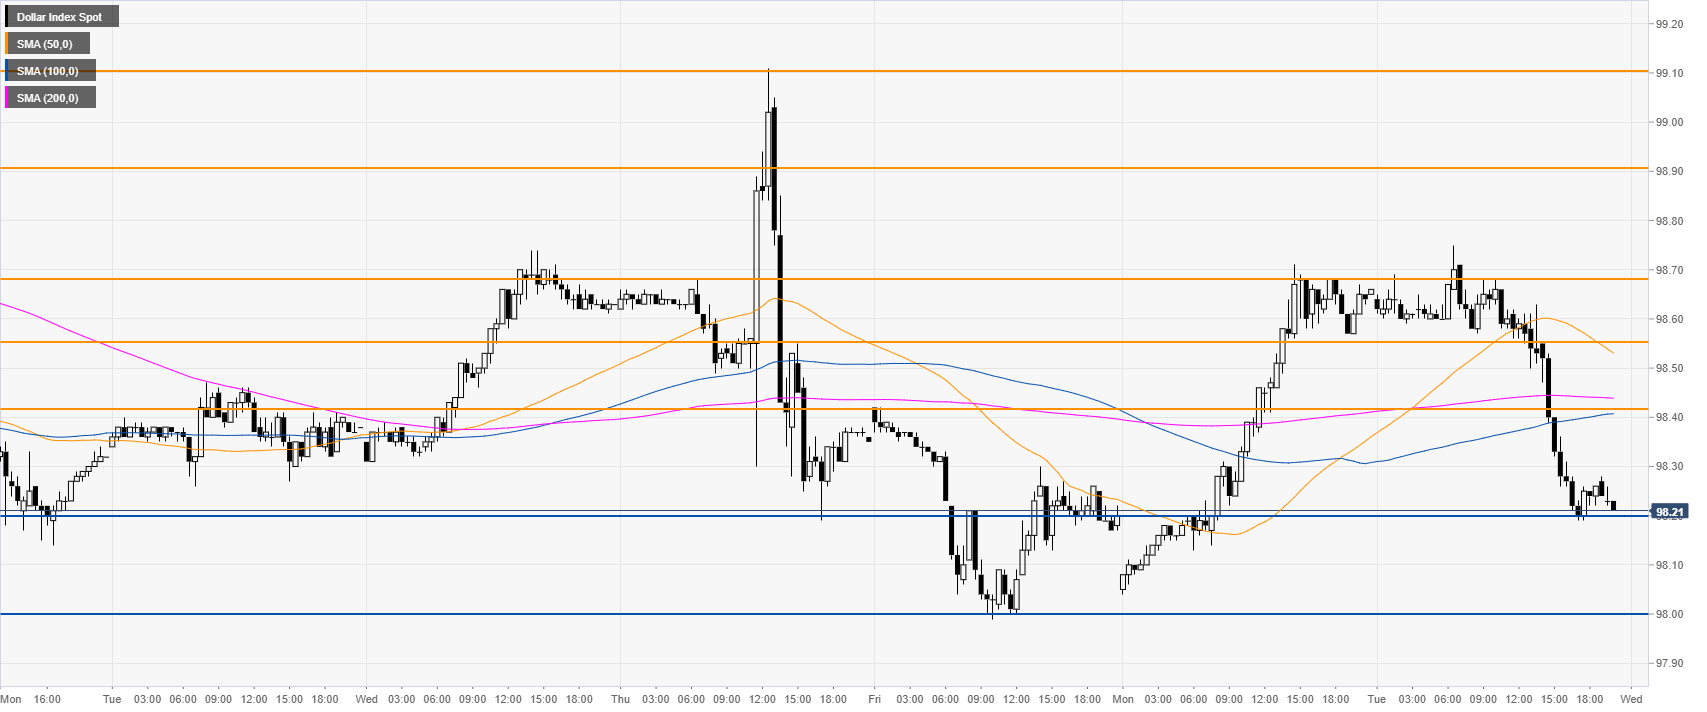
DXY 30-minute chart
DXY is trading below the main SMAs, suggesting a bearish bias in the near term. Immediate resistance is at the 98.42 and 98.55 price levels.
Additional key levels
