- DXY (US Dollar Index) is challenging the Tuesday’s highs.
- The market is nearing an important resistance level at the 98.10 level.
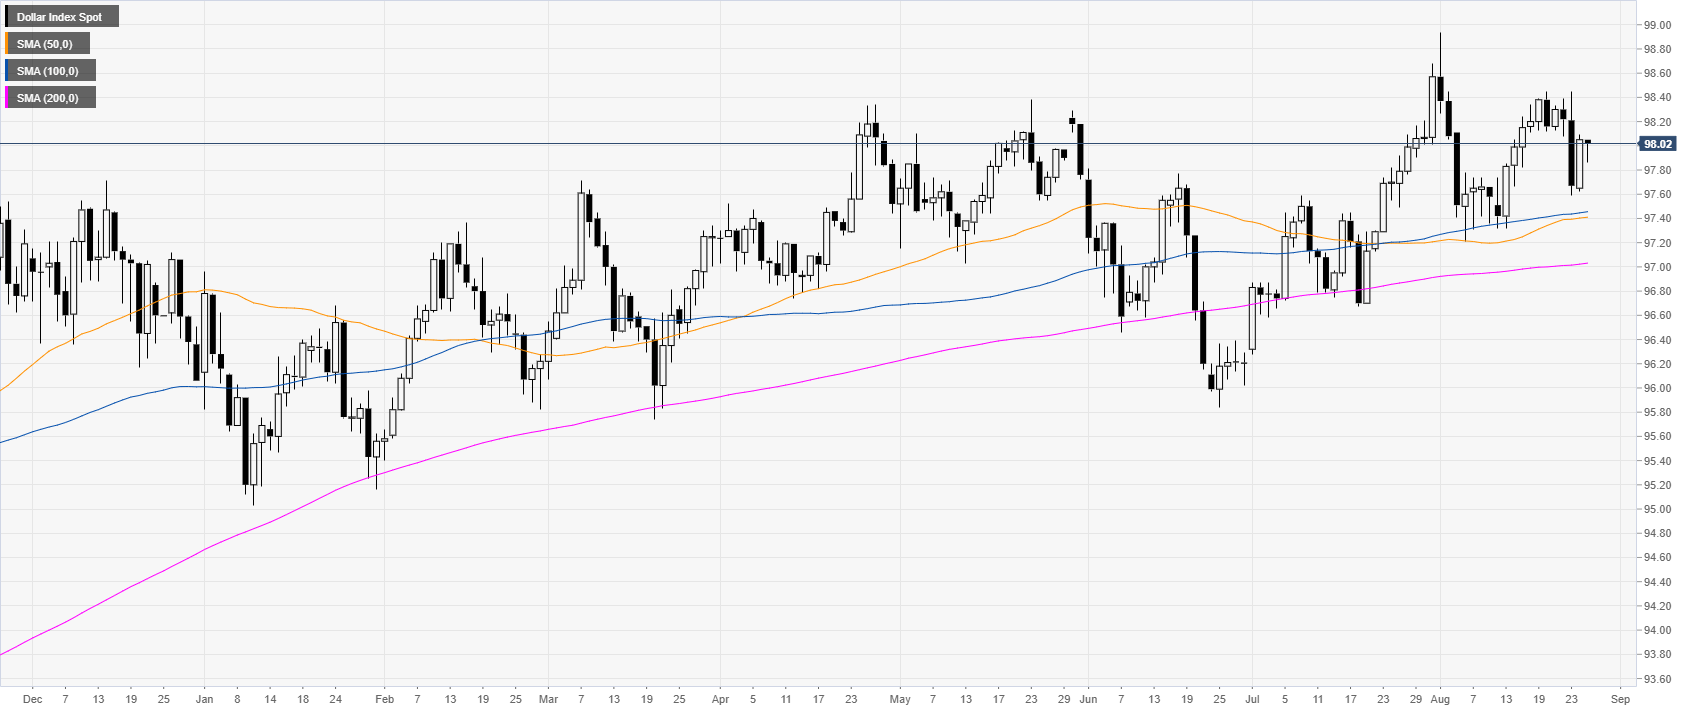
DXY daily chart
DXY (US Dollar Index) is trading in a bull trend above the main daily simple moving averages (DSMAs). The market is in a small range this Tuesday.
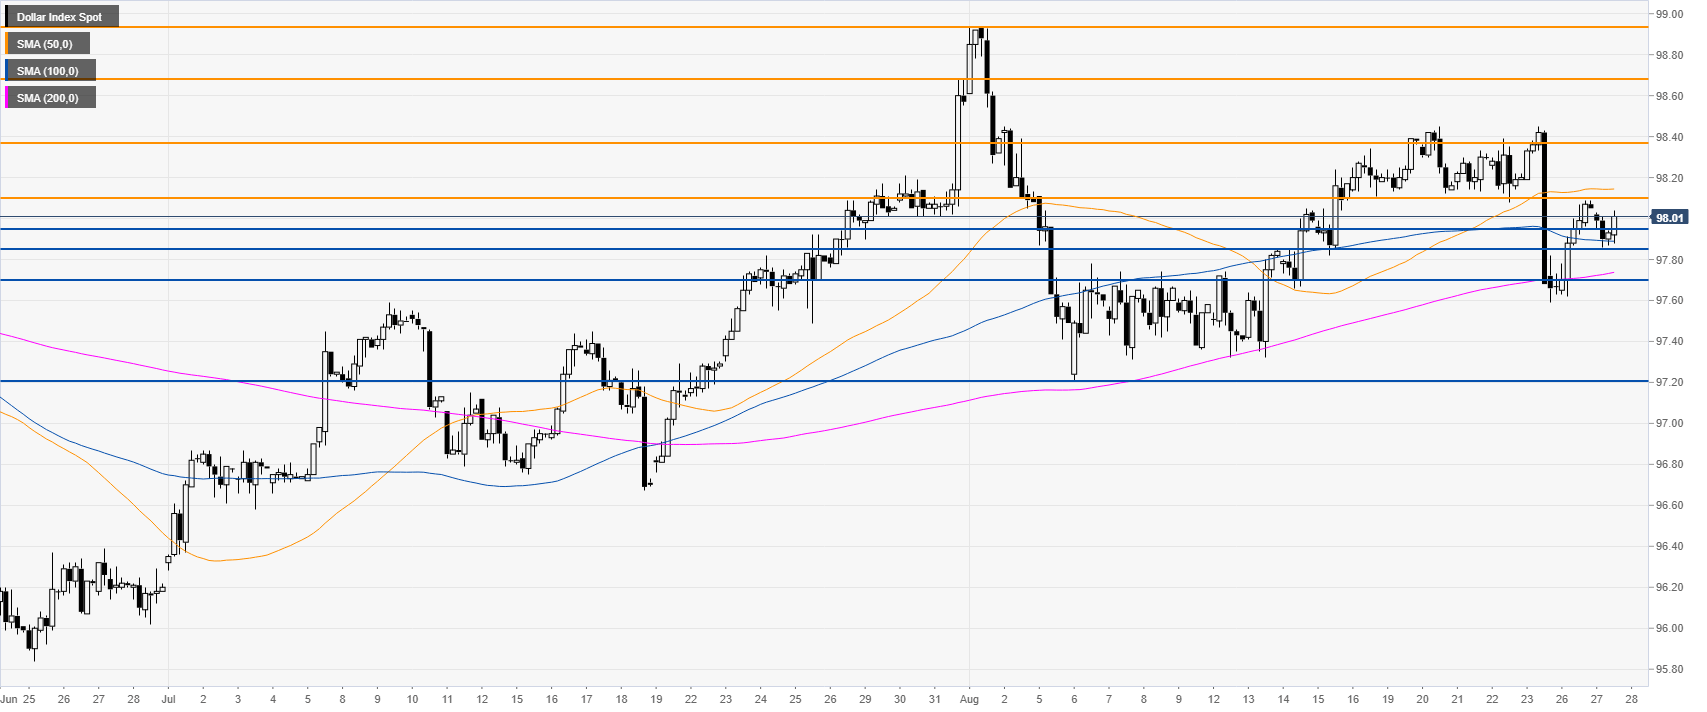
DXY 4-hour chart
DXY is approaching a critical resistance at the 98.10 level near the 50 SMA. If the buyers manage to have a sustained breakout above this level, the market could test 98.38 on the way up.
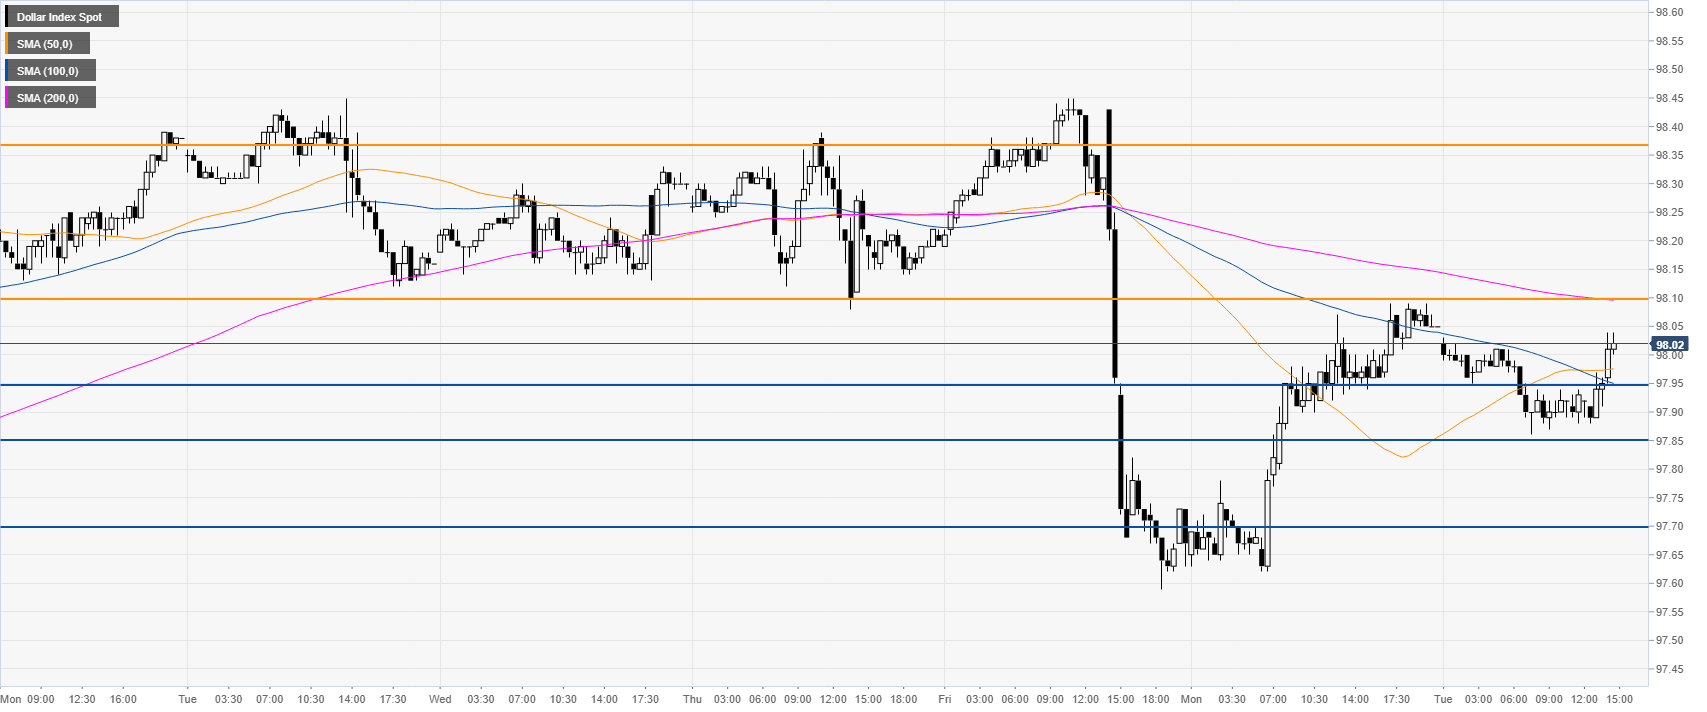
DXY 30-minute chart
The Greenback is trading below a descending 200 SMAs, suggesting a bearish bias in the short term. However, sellers would need to defend the 98.10 resistance and clear 97.95/85 and 97.70 support if they want to generate a meaningful breakdown towards the 97.20 level.
Additional key levels
