- DXY (US Dollar Index) is advancing towards the 2019 high as the market is holding above the 98.45 support.
- The next key resistance can be located near the 98.68 level.
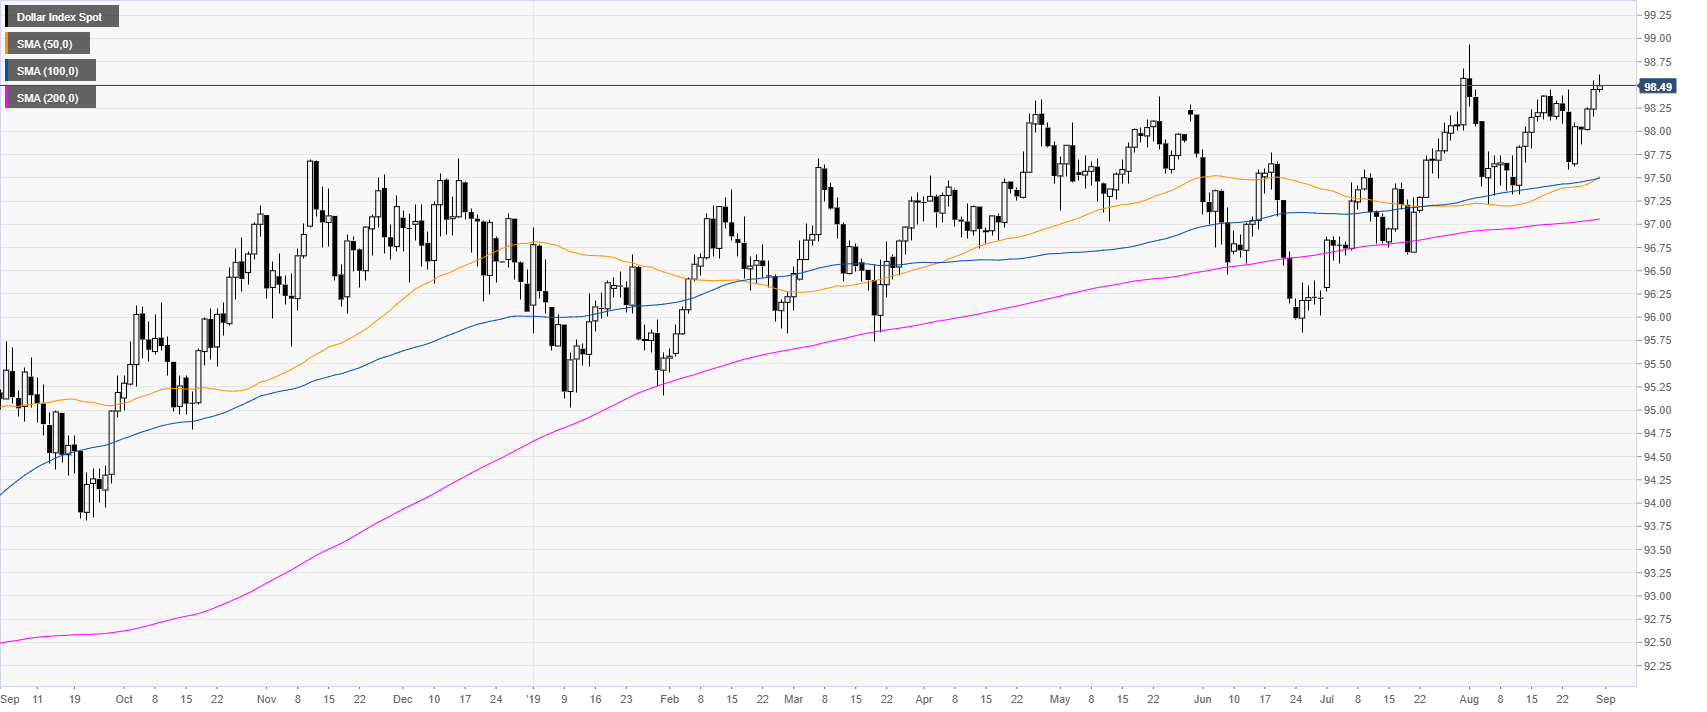
DXY daily chart
DXY (US Dollar Index) is in a bull trend above the main daily simple moving averages (DSMAs). The market is nearing the 2019 high at 98.94.
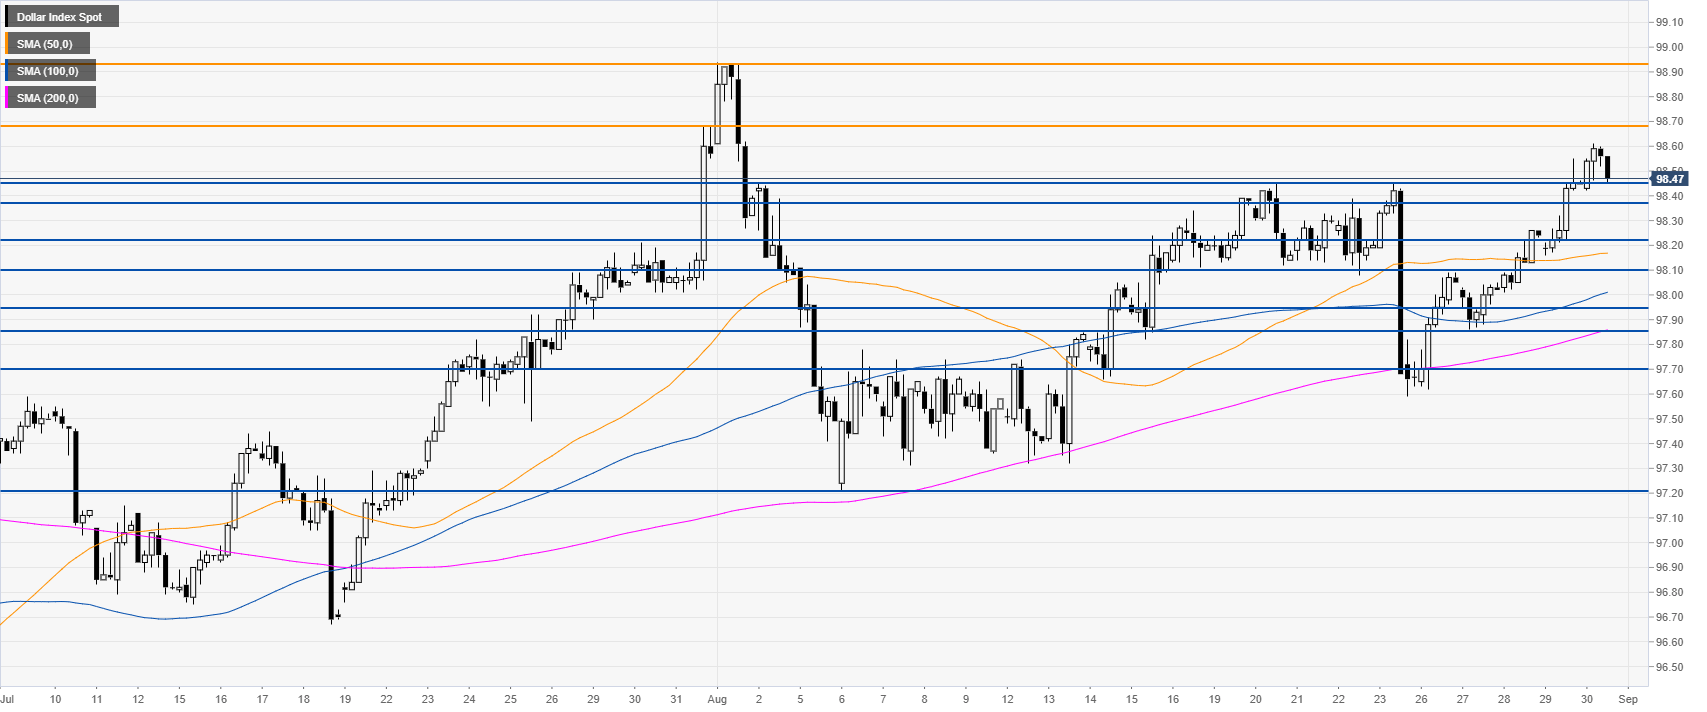
DXY 4-hour chart
DXY broke above 98.45 resistance opening the gates for a potential continuation up towards 98.68 and 98.94 (the 2019 high) on the way up. If the market holds above the 98.45 level, it would be seen as a bullish sign.
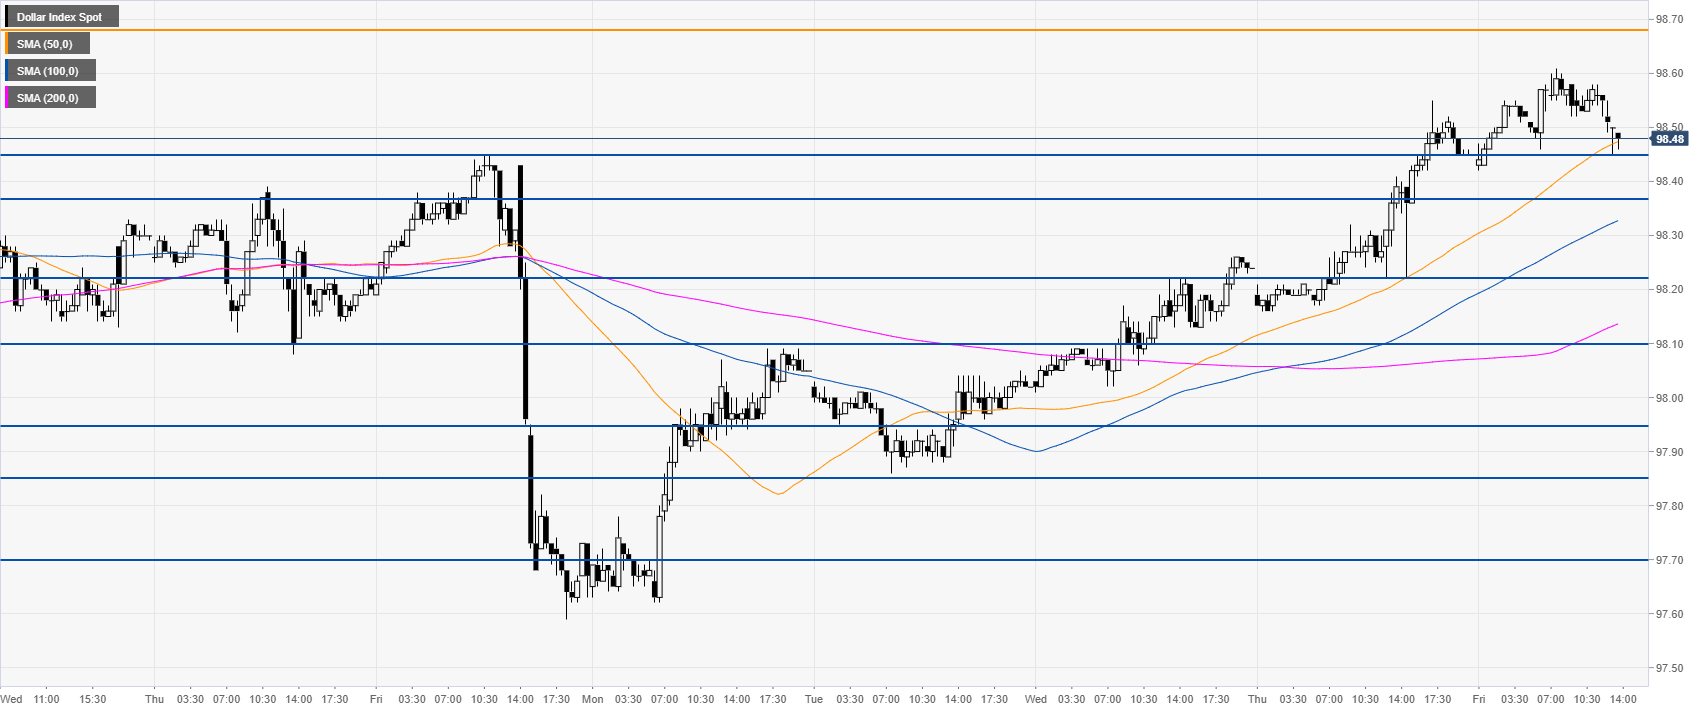
DXY 30-minute chart
The Greenback is trading above the main SMAs, suggesting bullish momentum in the short term. Immediate support is seen at the 98.45 and the 98.38 levels.
Additional key levels
