- The Greenback erased the gains made on Wednesday after the Fed cut rates.
- DXY (US Dollar Index) is trapped in a two-week range.
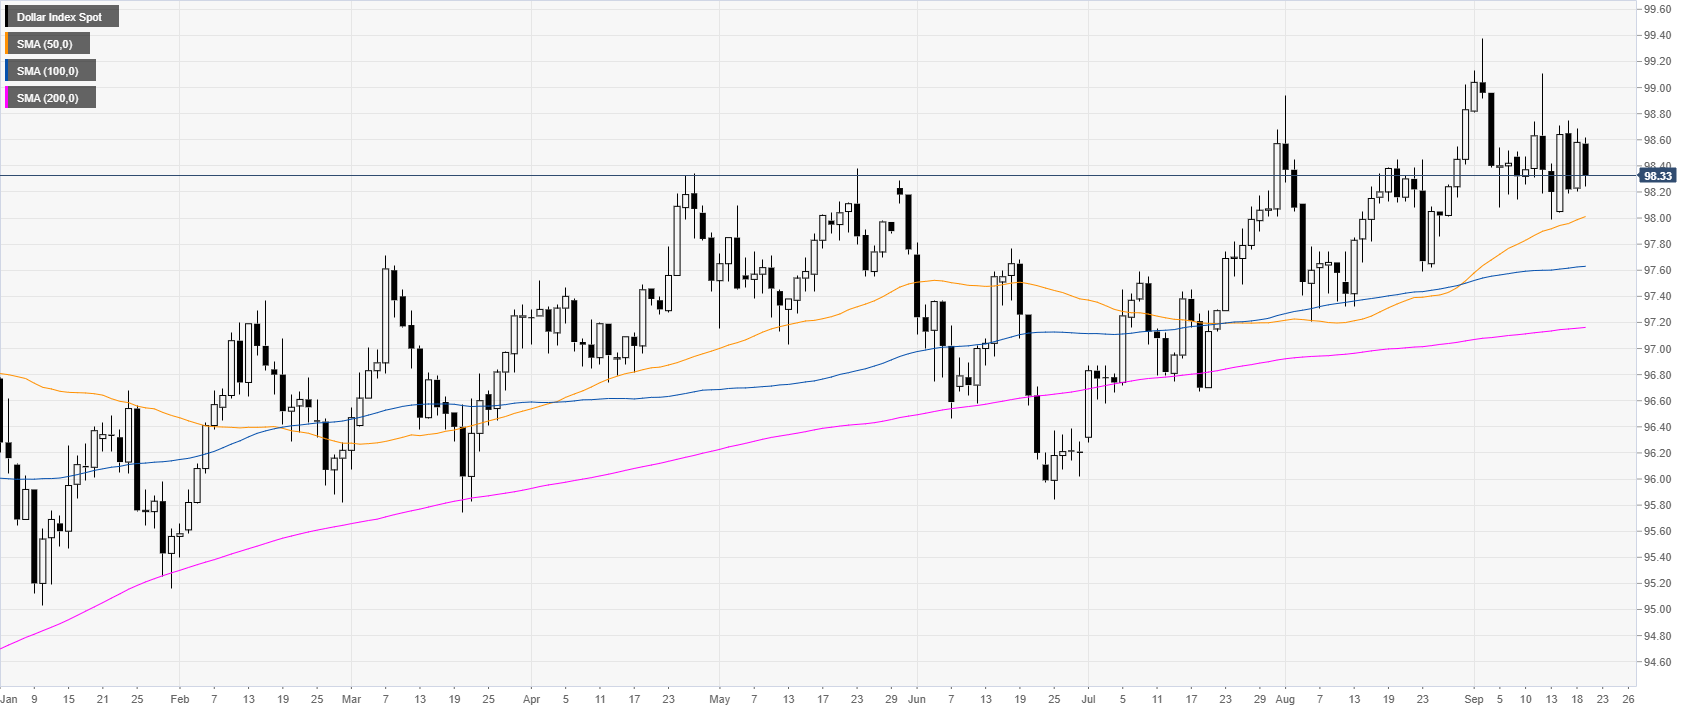
DXY daily chart
DXY (US Dollar Index) is trading in a bull trend above the main daily simple moving averages (DSMAs). However, the Greenback has been trading in a trading range in the last two weeks. On Wednesday, the Fed cut 25 bps as it was widely expected but from a technical perspective, nothing as substantially changed.
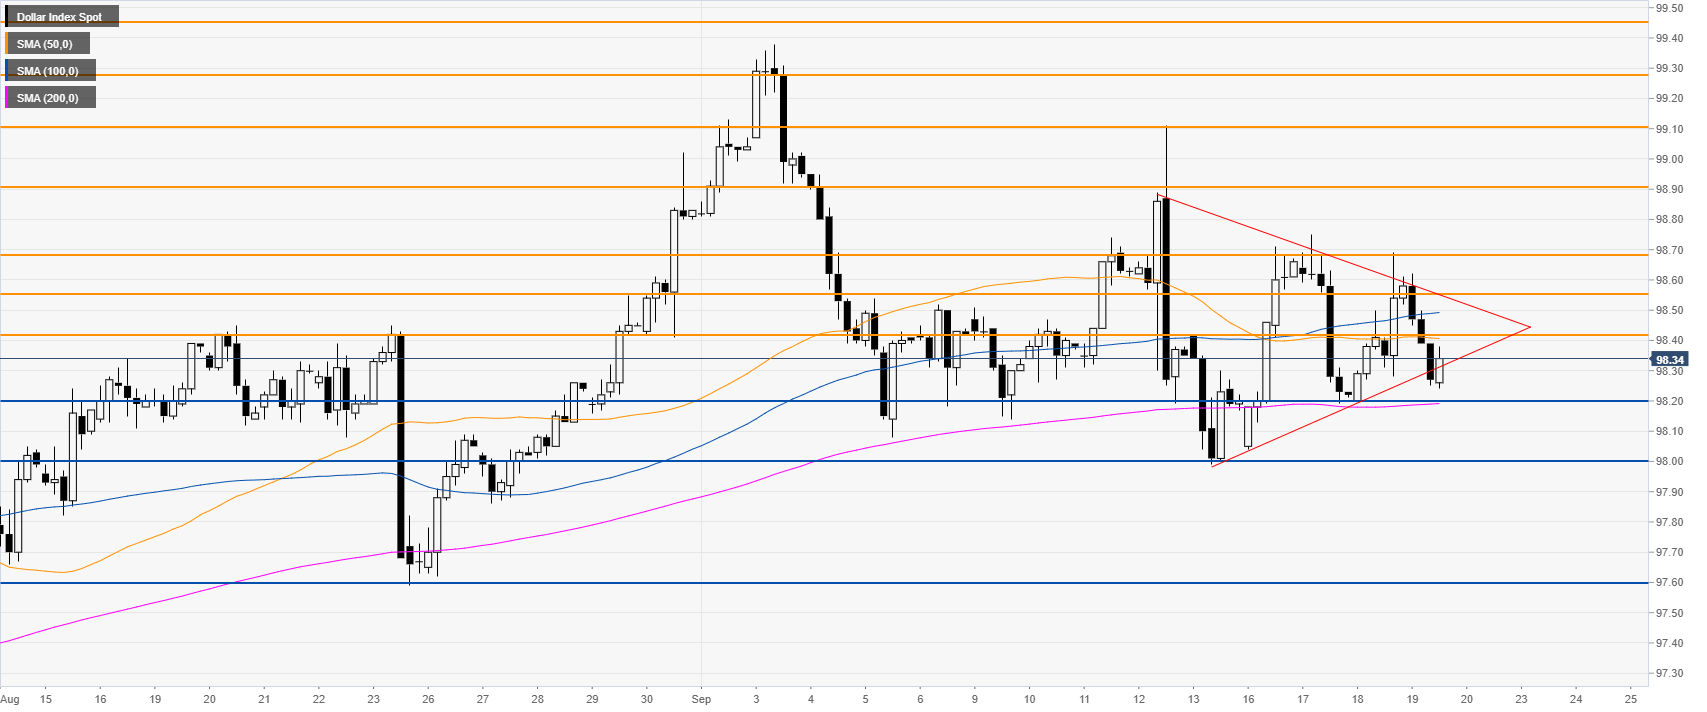
DXY four-hour chart
DXY is in a range above the 98.20 support and the 200 SMA. There is little directional bias as the range is getting nearer and nearer. Arguably DXY is also forming a triangle pattern with a potential breakout in either direction.
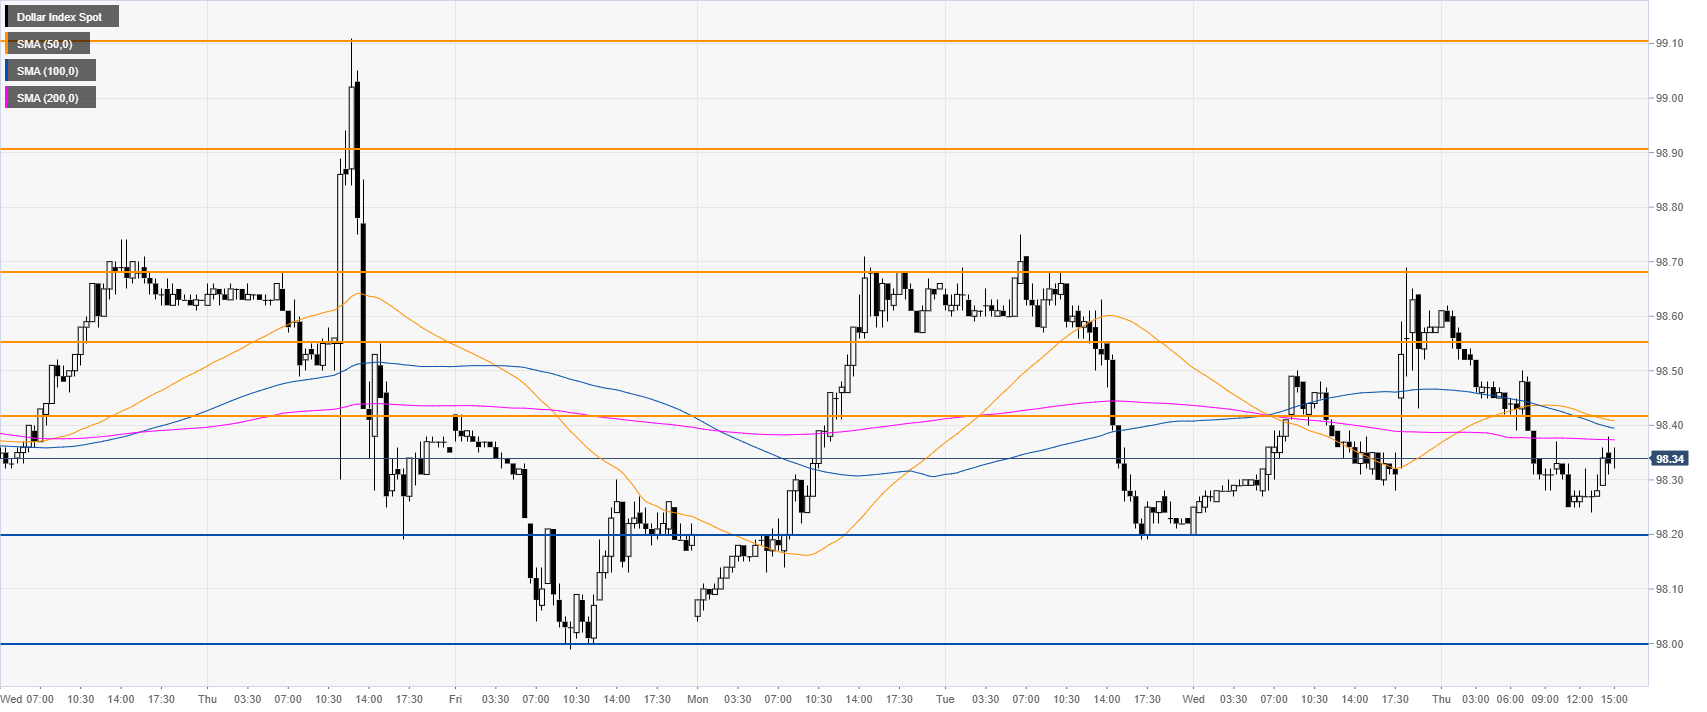
DXY 30-minute chart
DXY was quick to erase the Fed’s inspired spike seen on Wednesday. The market is bouncing from the 98.20 level. Foe any meaningful move to happen, bulls would need a break above the 98.68 resistance while bears would need to clear the 98.00 support.
Additional key levels


