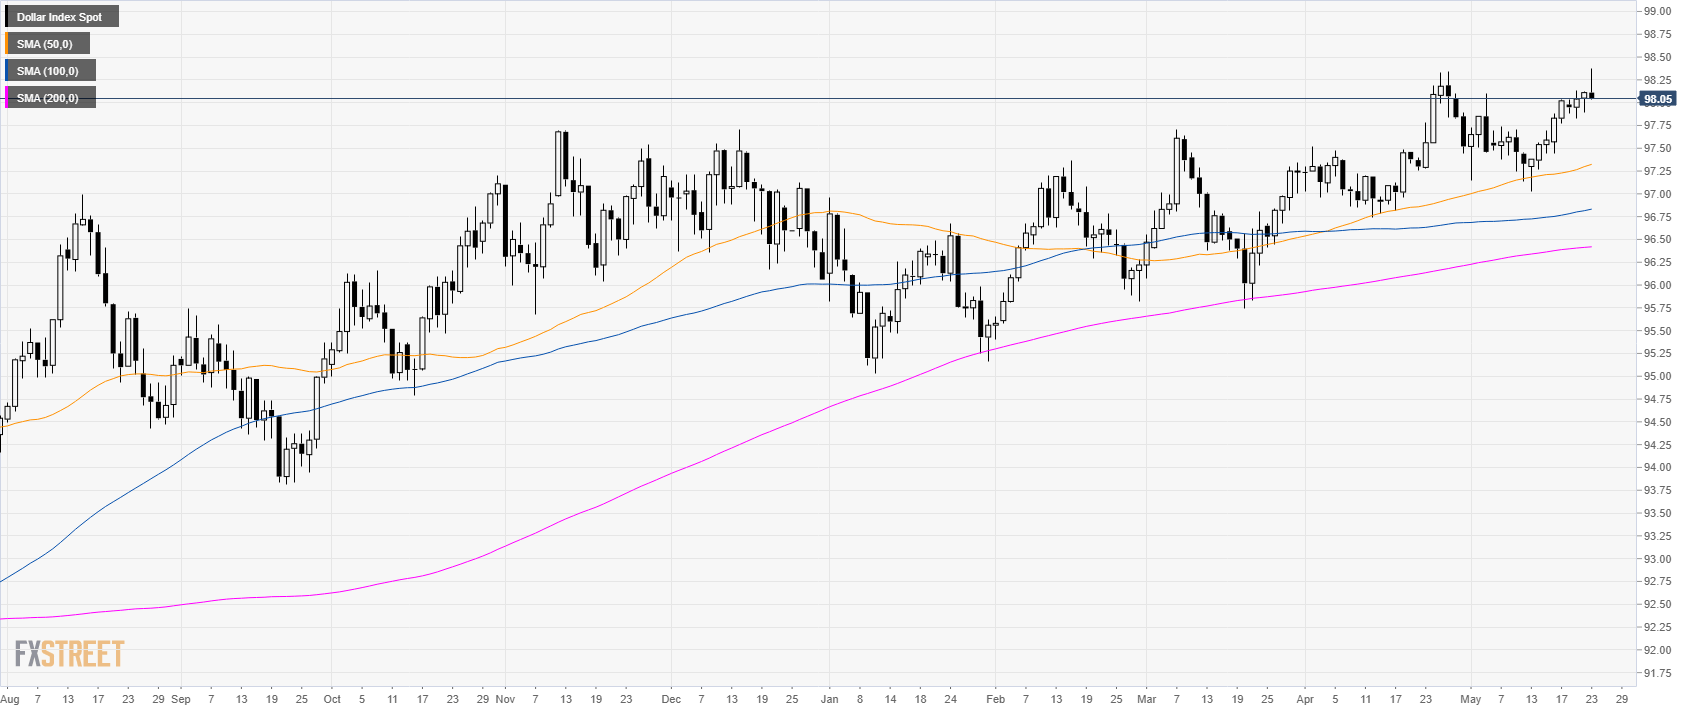
DXY daily chart
The US Dollar Index (DXY) is trading in a bull trend above its main simple moving averages (SMAs).
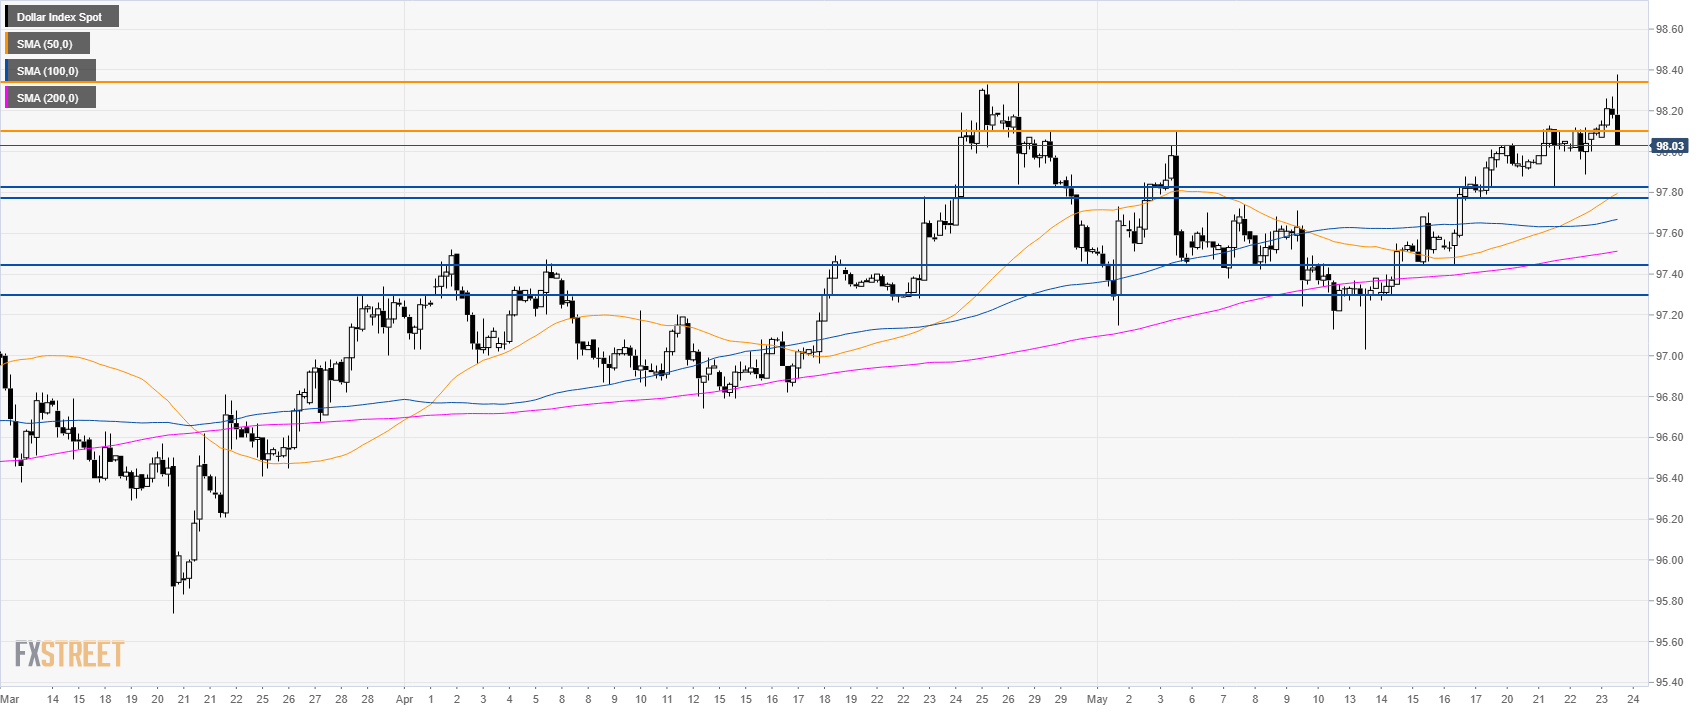
DXY 4-hour chart
The greenback didn’t find acceptance above the 2019 high at 98.34. Although the market reached 98.34 on an intraday basis this Thursday it seems unlikely the market is going to close above this level.
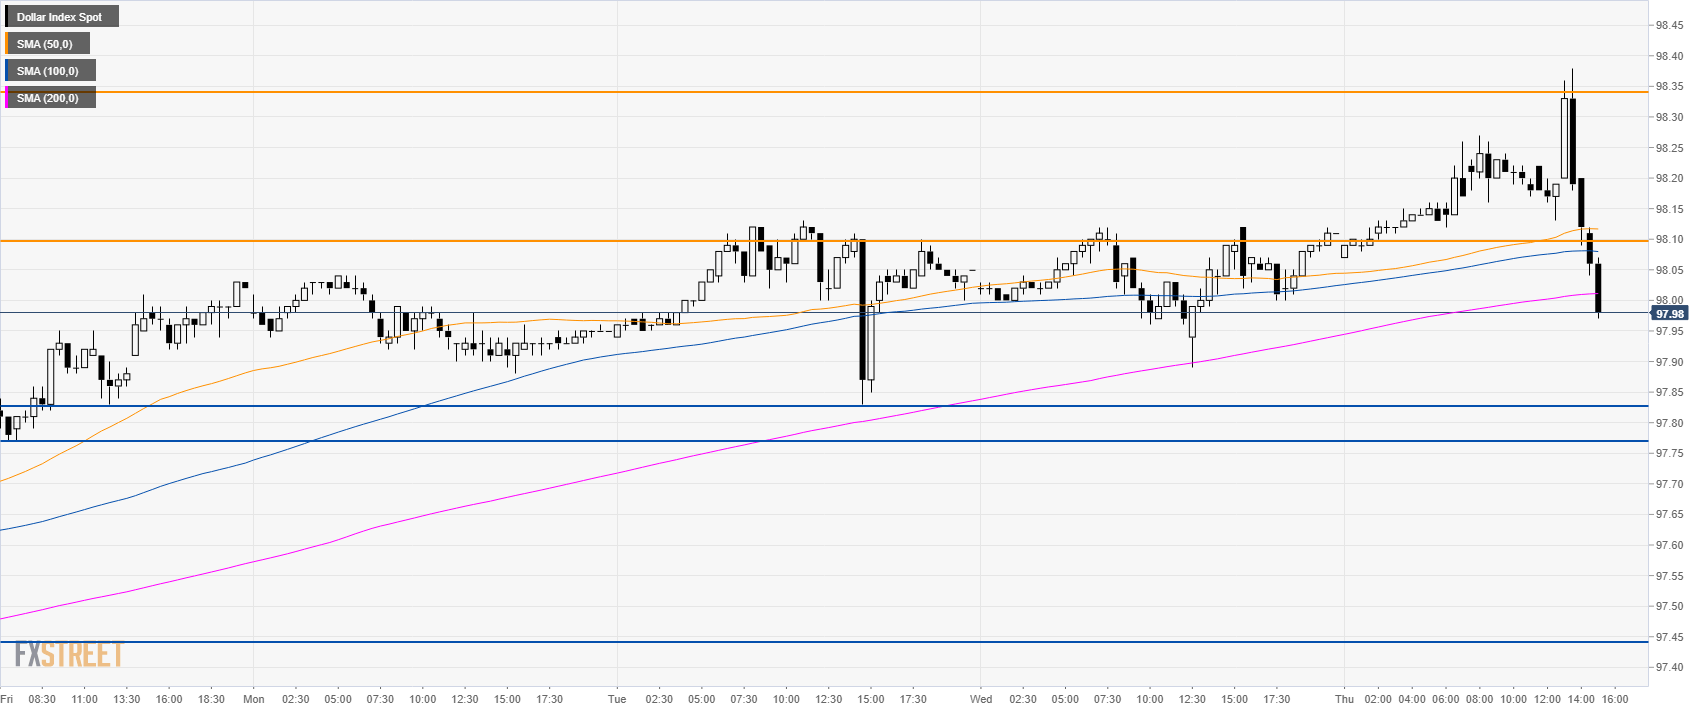
DXY 30-minute chart
DXY bears brought the index below the 98.10 level as they are testing the 200 SMA. The momentum is turning negative as 97.83 and 97.77 support might be the next bearish target. Further down lies 97.45 support. Resistances are at 98.10 and 98.34 levels.
Additional key levels
