- DXY decelerates and finds some resistance near 98.10.
- Support levels can be seen near 97.80 and 97.55.
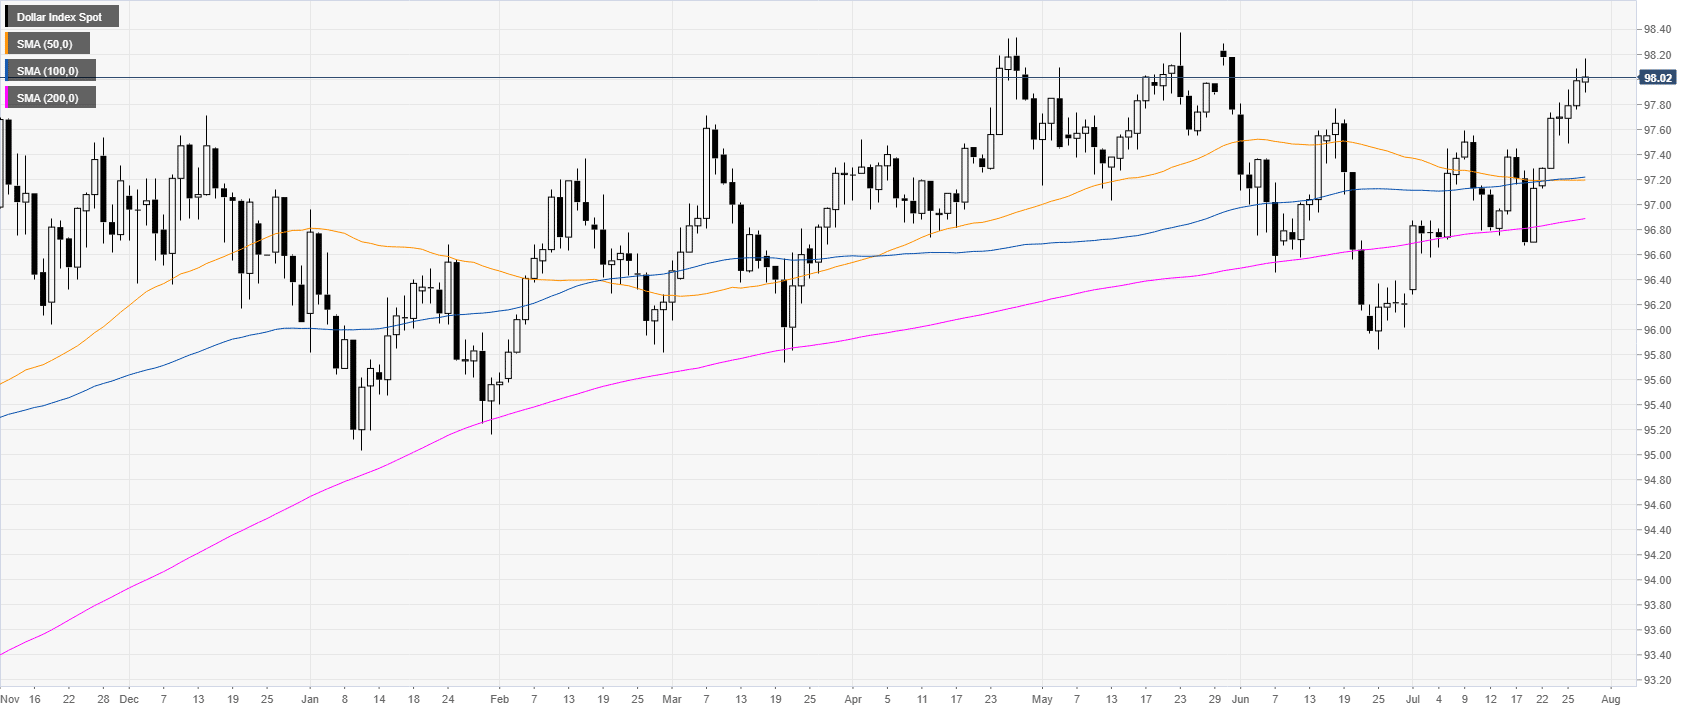
DXY daily chart
The market is trading in a bull trend above the main daily simple moving averages (DSMAs) as well as the 97.55 support.
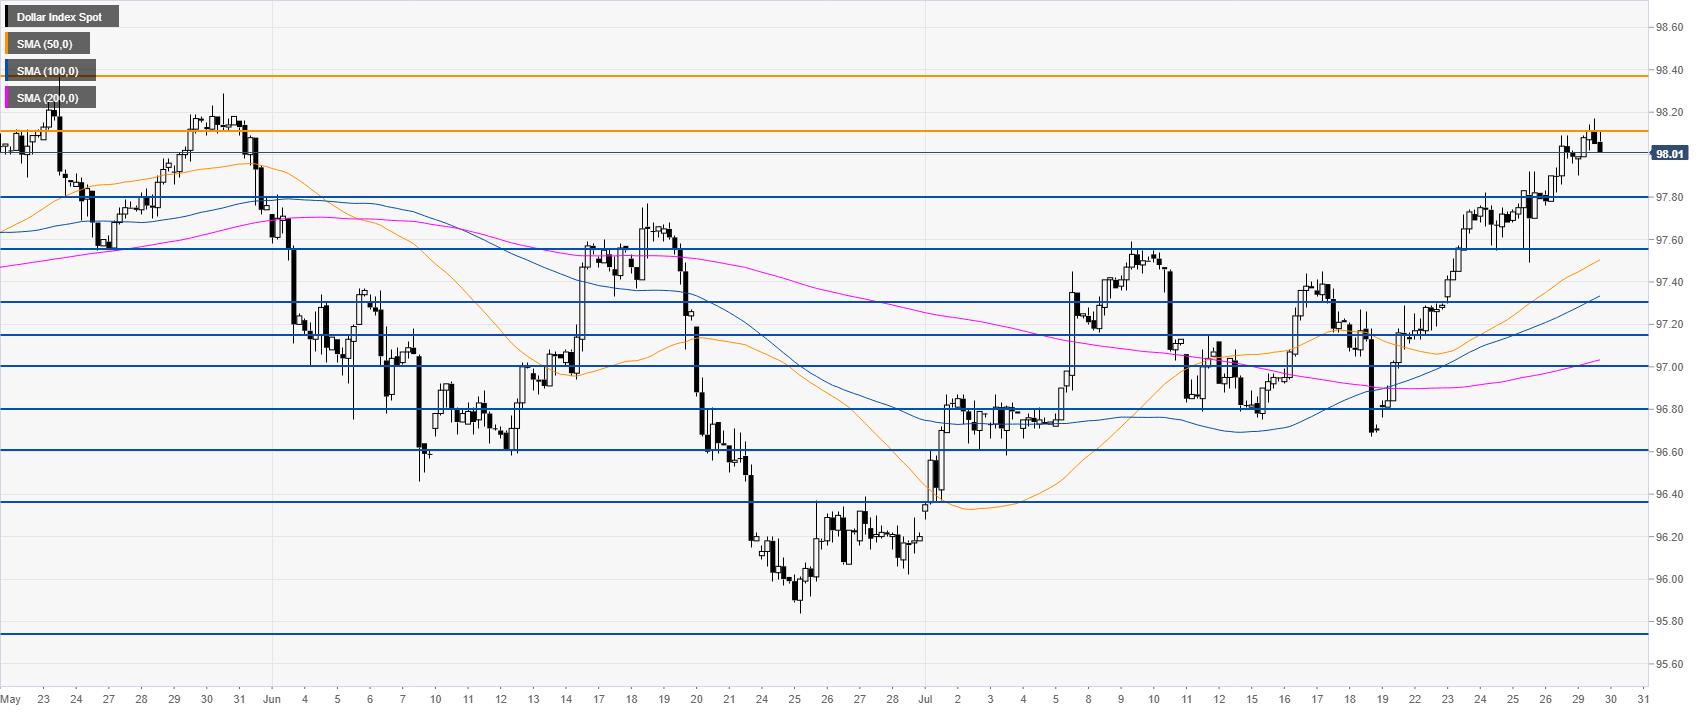
DXY 4-hour chart
DXY is trading above its main SMAs, suggesting bullish momentum. Bulls lost some ground this Monday as the market is currently rejecting 98.10 resistance. Bulls need to overcome this level if they want to reach the 2019 high at 98.38.
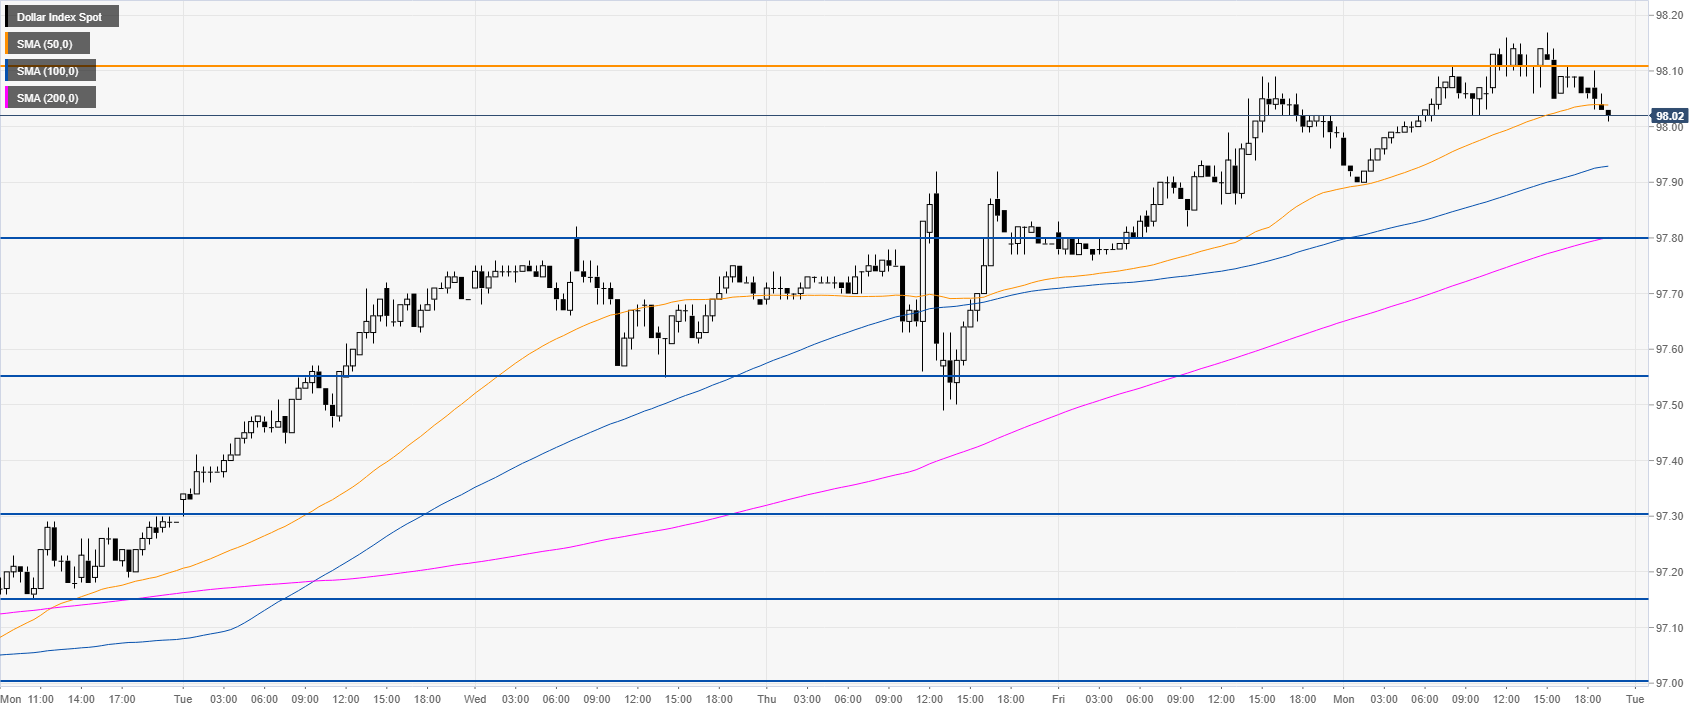
DXY 30-minute chart
DXY is trading below the 50 SMA, suggesting a potential pullback in the near term. Support levels can be located near 97.80 and 97.55.
Additional key levels
