- DXY (US Dollar Index) is down little following the release of the NFP in the United States.
- The level to beat for bulls is at 98.42 and 98.68 resistance levels.
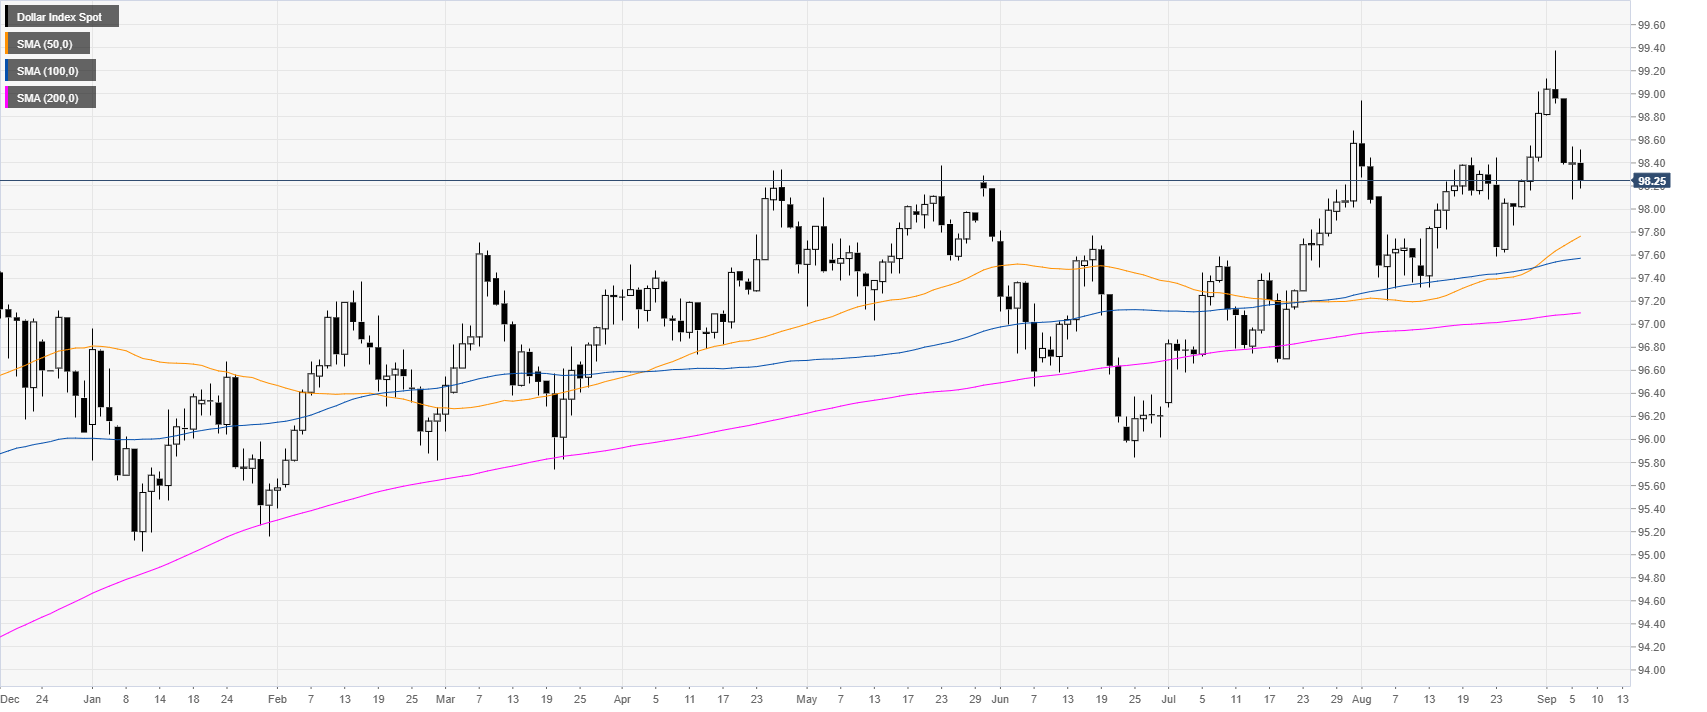
DXY daily chart
DXY (US Dollar Index) is trading in a bull trend above the main daily simple moving averages (DSMAs). DXY is having a small dip following the release of the Non-farm Payrolls (NFP) in the United States (US). The monthly data came in below expectations with only 130K jobs added in August vs. 158K forecast. However, the wages, the Average Hourly Earnings, beat expectations with 3.2% vs. 3.1% forecast.
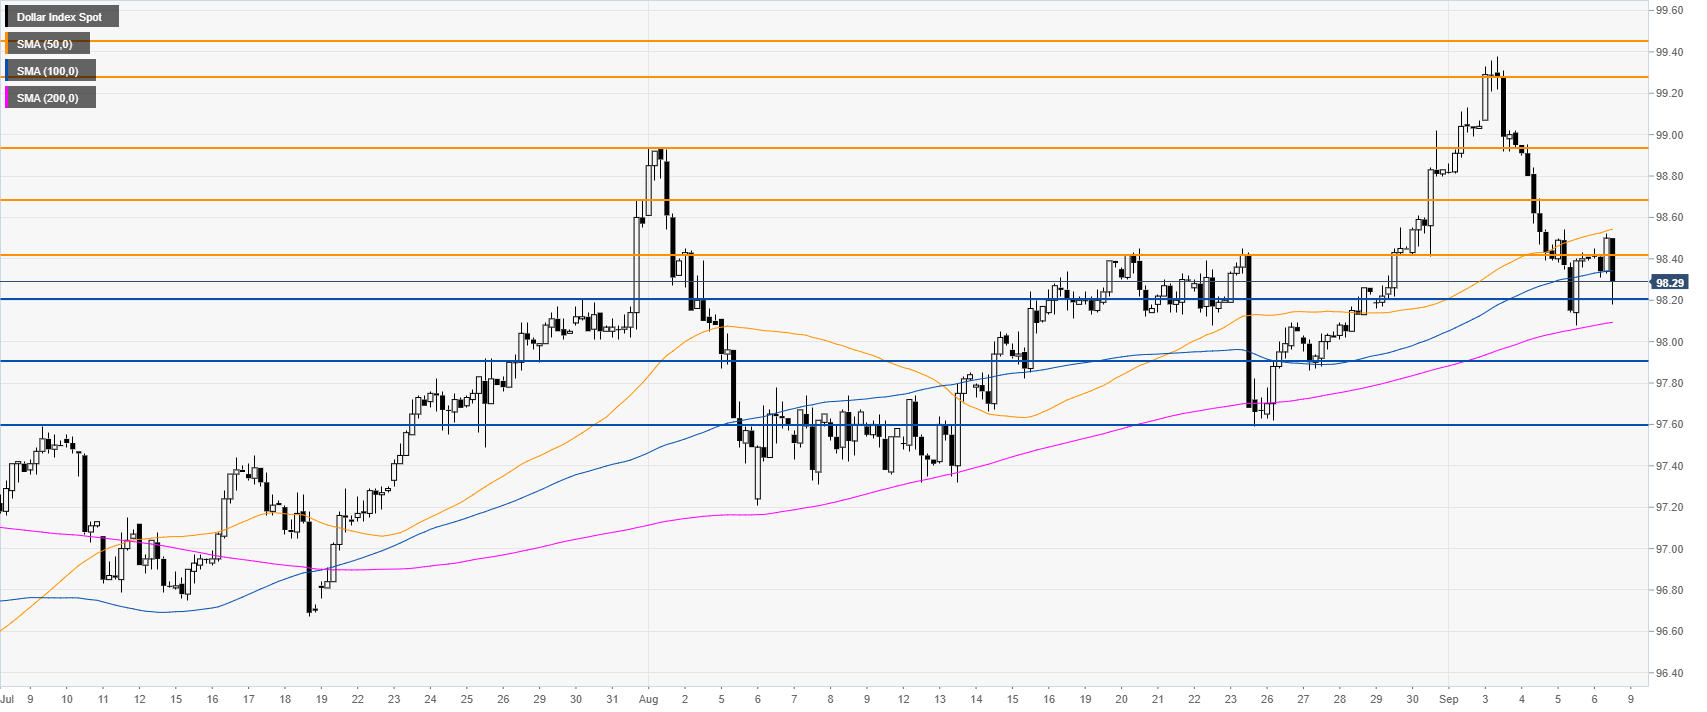
DXY four-hour chart
The Greenback is trading above the 98.20 support and the 200 SMA. DXY bulls will need to bring the market above the 92.42 to reclaim the 98.68 price level in the medium term.
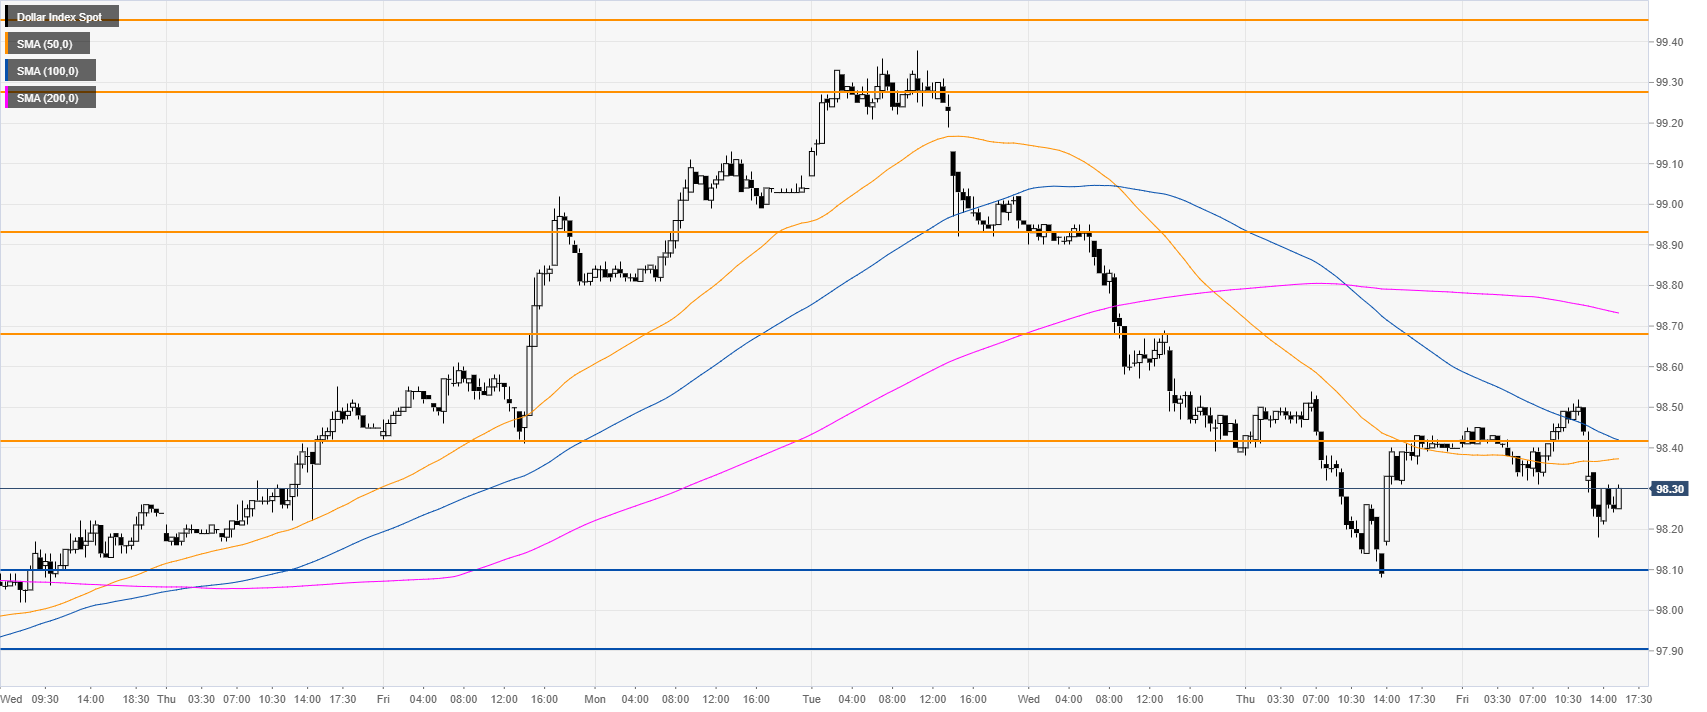
DXY 30-minute chart
DXY is trading below the main SMAs, suggesting bearish momentum in the near term. The market can enter a consolidation with 98.10 as main support. However, if breached to the downside 97.90 can come into play in the short term.
Additional key levels
