- DXY (US Dollar Index) remains confined in a tight range for the fourth consecutive day.
- The levels to beat for bulls is at the 98.55 resistance level.
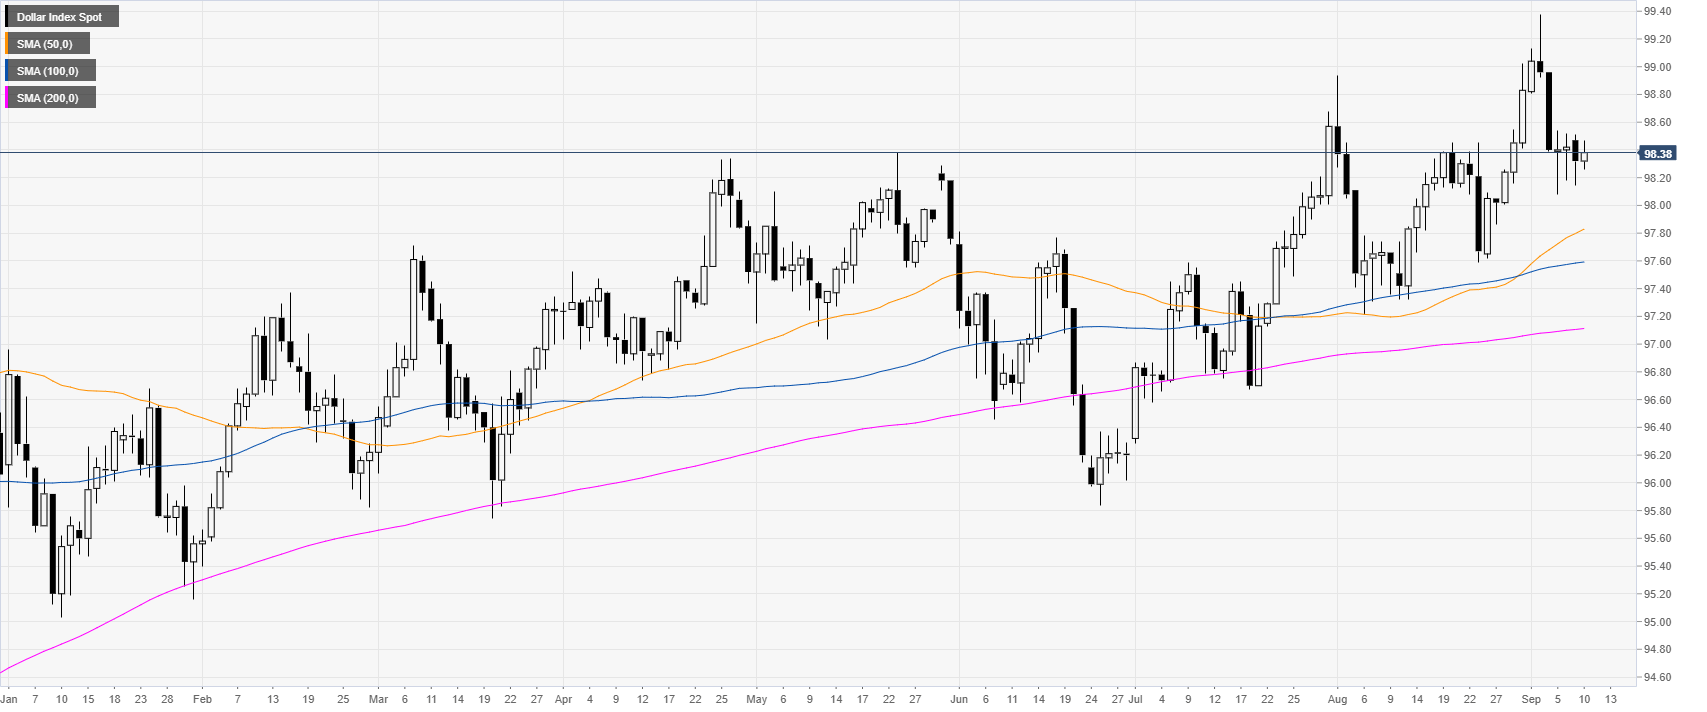
DXY daily chart
DXY (US Dollar Index) is evolving in a bull trend above the main daily simple moving averages (DSMAs). The Greenback is in its fourth day of consolidation in the 98.10/98.55 zone.
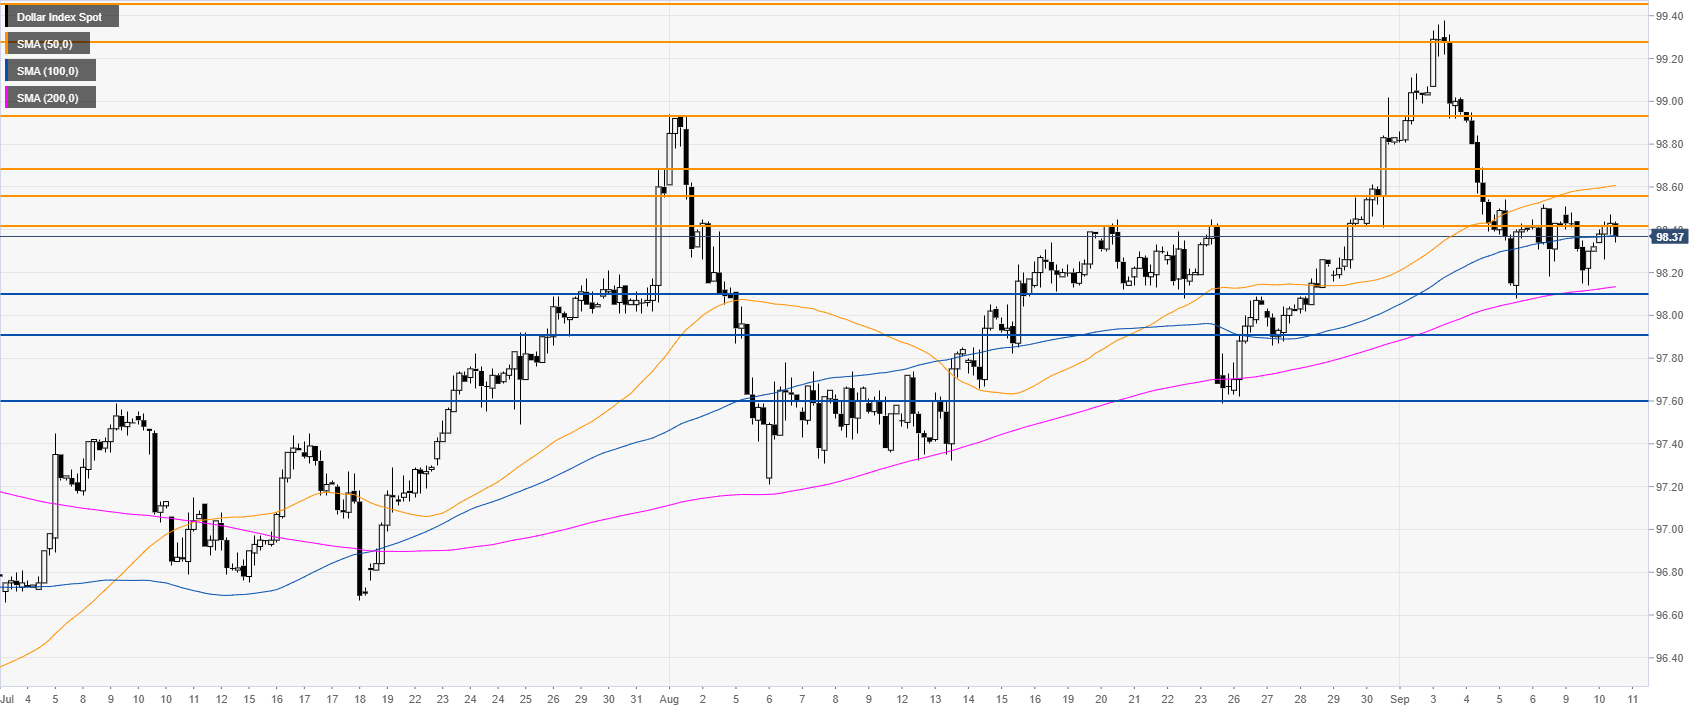
DXY four-hour chart
The Greenback is challenging the 98.42 resistance and the 100 SMA. DXY buyers need to overcome the 98.55 resistance to generate a potential breakout towards the 98.68 and 98.94 price levels in the medium term.
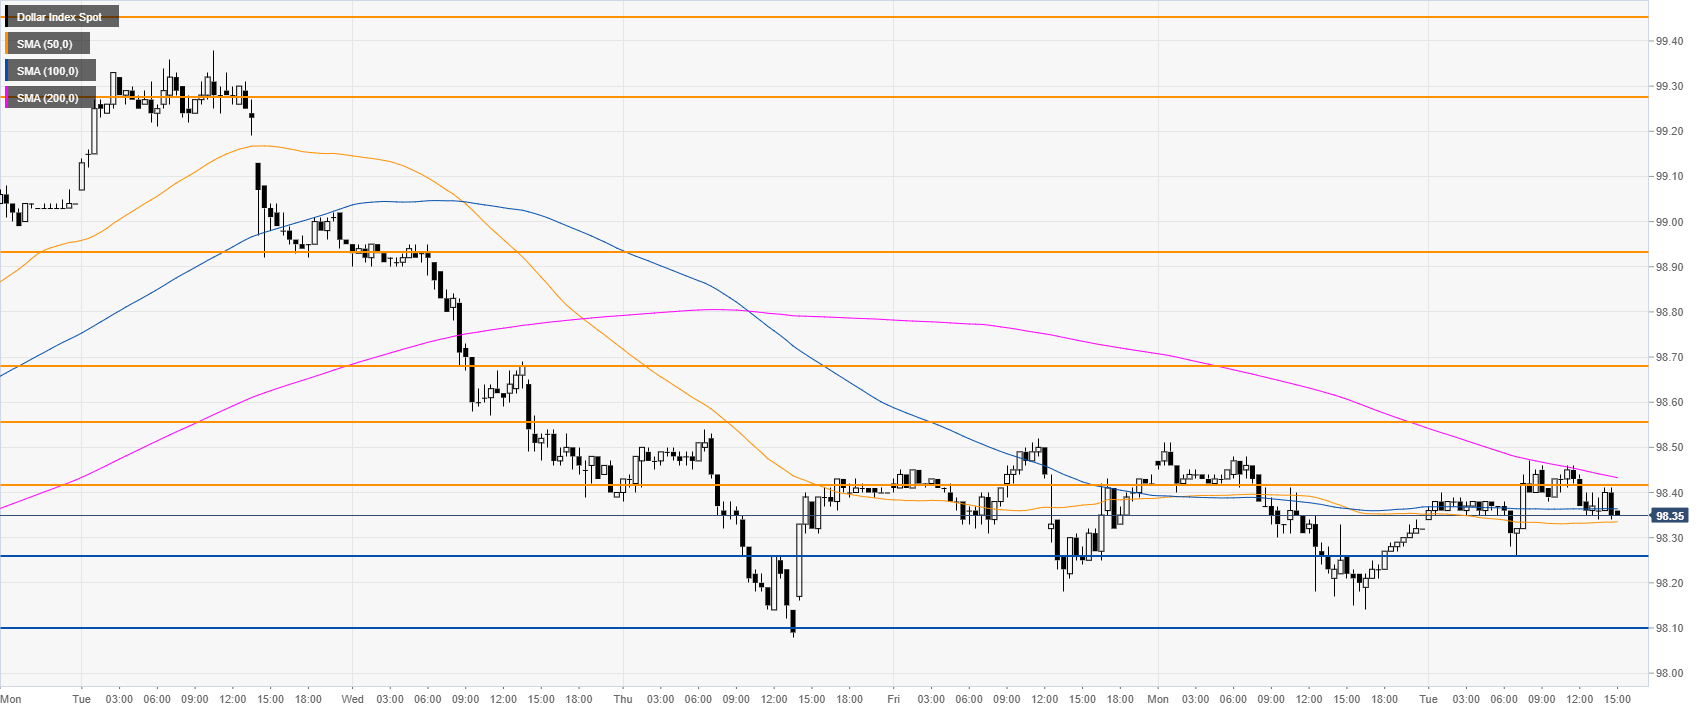
DXY 30-minute chart
DXY stays in range as the market is trading above flattening 50 and 100 SMAs. Immediate support is seen at the 98.26 and 98.10 price levels.
Additional key levels
