- DXY is off the daily lows as the New York session is coming into an end.
- The level to beat for sellers is the 98.63 level.
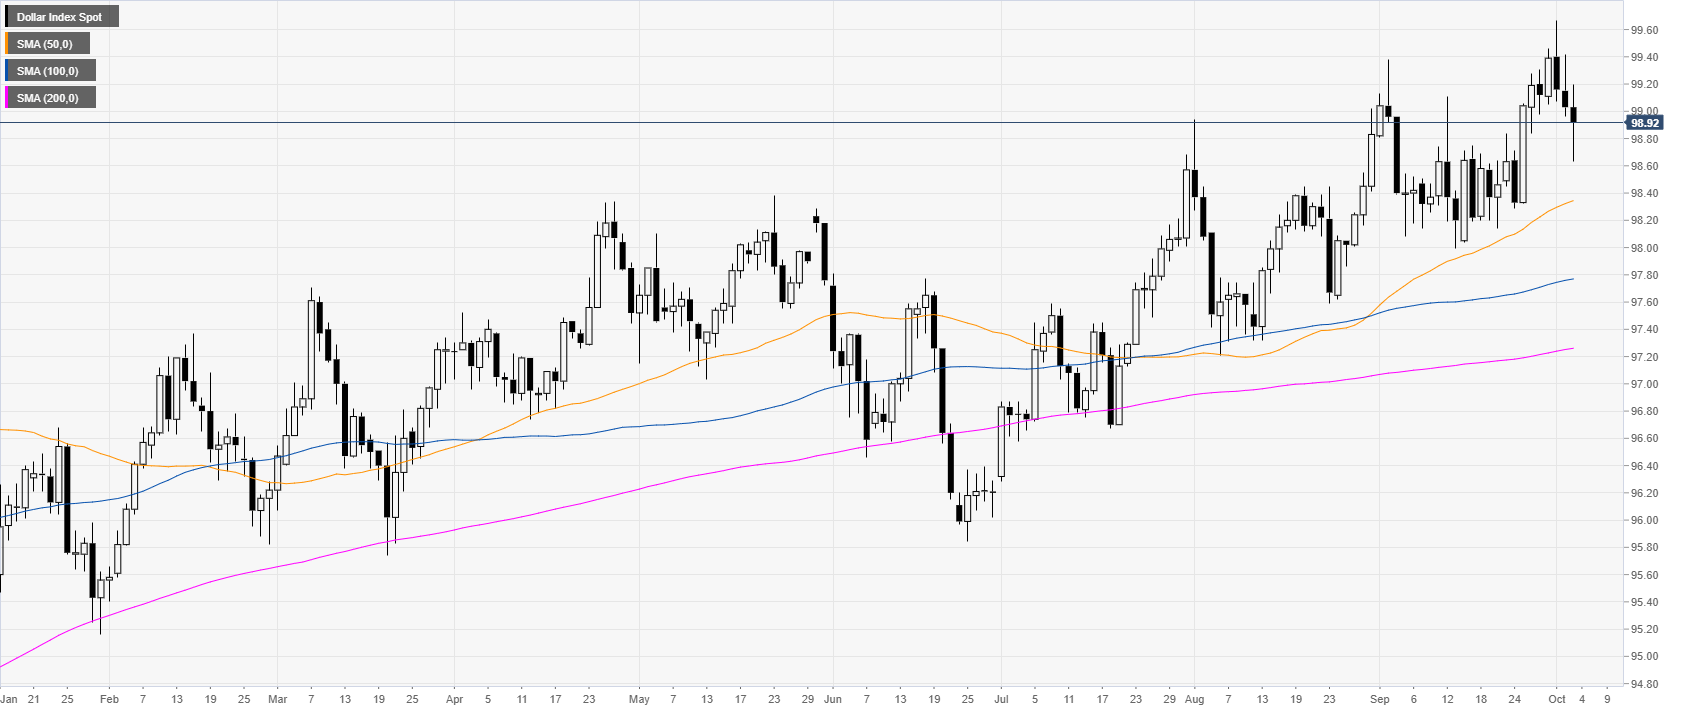
DXY daily chart
The US Dollar Index (DXY) is an uptrend above its main daily simple moving averages (DSMAs). This Thursday, the US ISM Non-Manufacturing PMI fell to 52.6 in September vs. 55 forecast. This adds to the negative sentiment on the Greenback which was triggered on Tuesday after the ISM Manufacturing PMI came in at their lowest in 10 years at 47.8 vs. 50.1 forecast while on Wednesday, the ADP, the forerunner of the Nonfarm Payrolls scheduled for Friday, disappointed the market with only 135k vs. 140k expected in September.
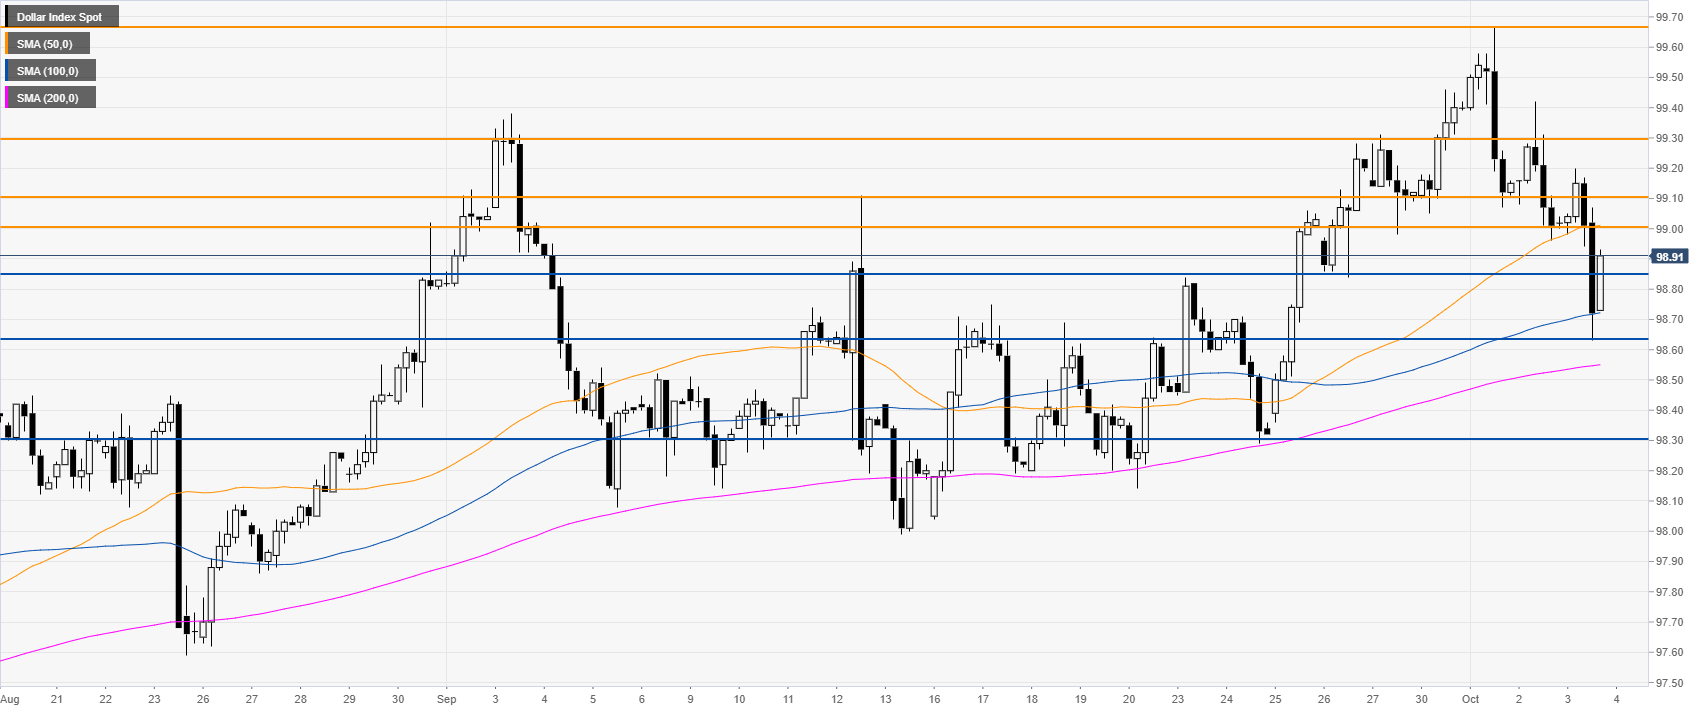
DXY four-hour chart
DXY is retracing down from the 2019 high as the market is trading between the 50 and 100 SMAs. A break of 98.63 (current Thursday low) can expose the 98.30 level.
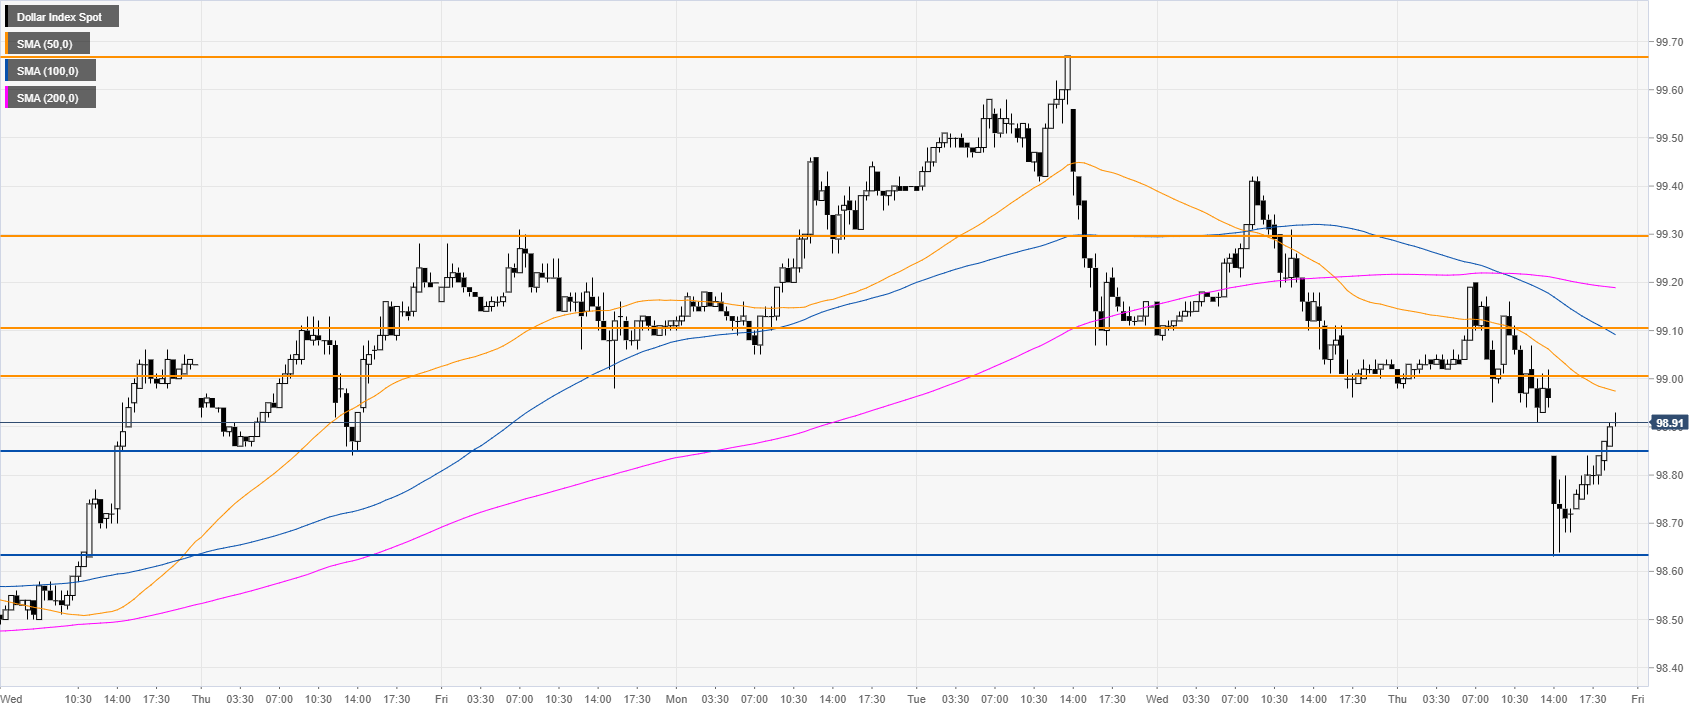
DXY 30-minute chart
DXY is trading below its main SMAs, suggesting a bearish bias in the short term. Immediate resistance is seen at the 99.00 and 99.10 price levels, followed by 99.30.
Additional key levels
