DXY daily chart
The US Dollar Index (DXY) is trading in a bull trend above its main simple moving averages (SMAs).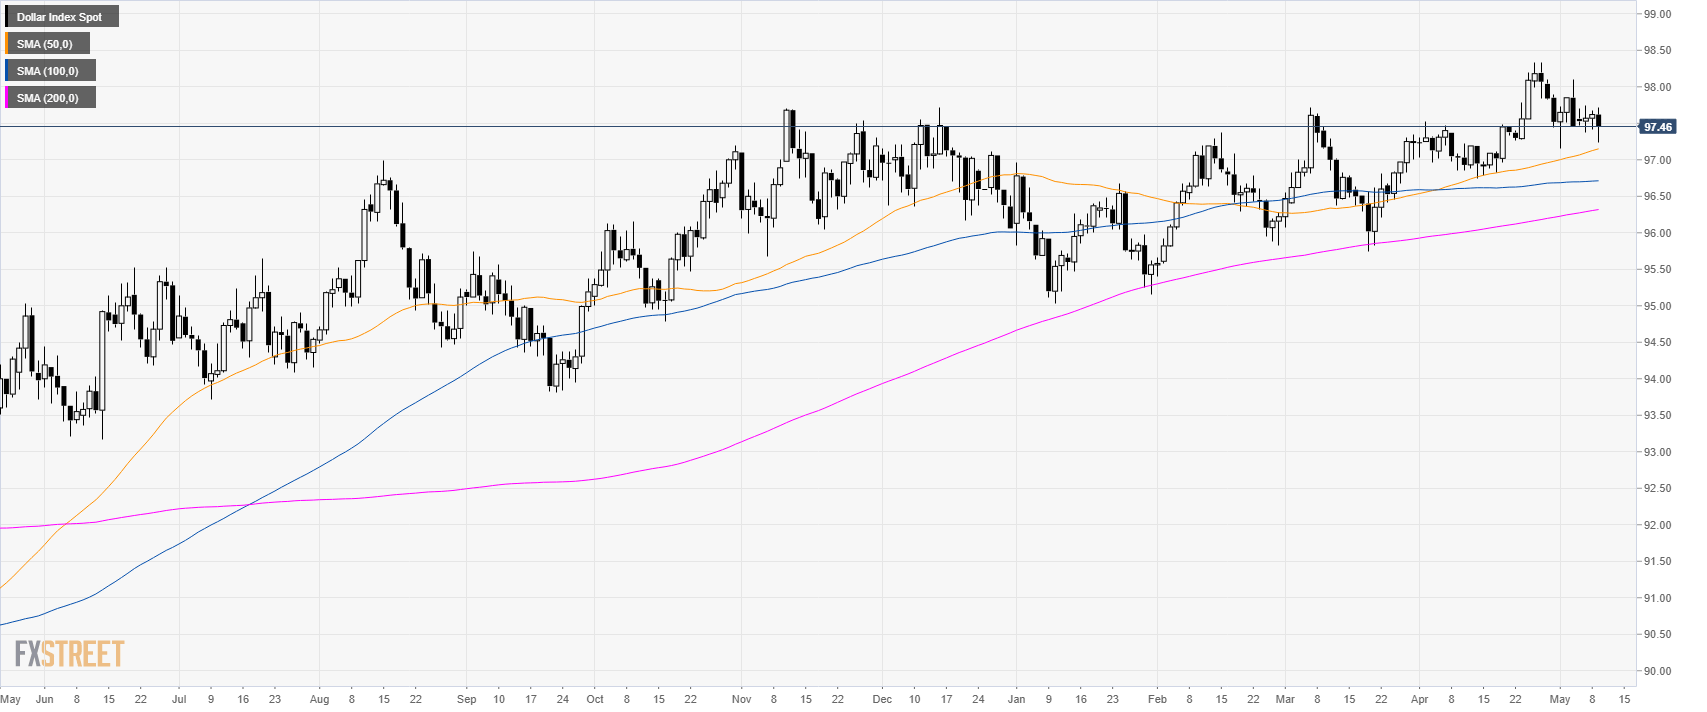
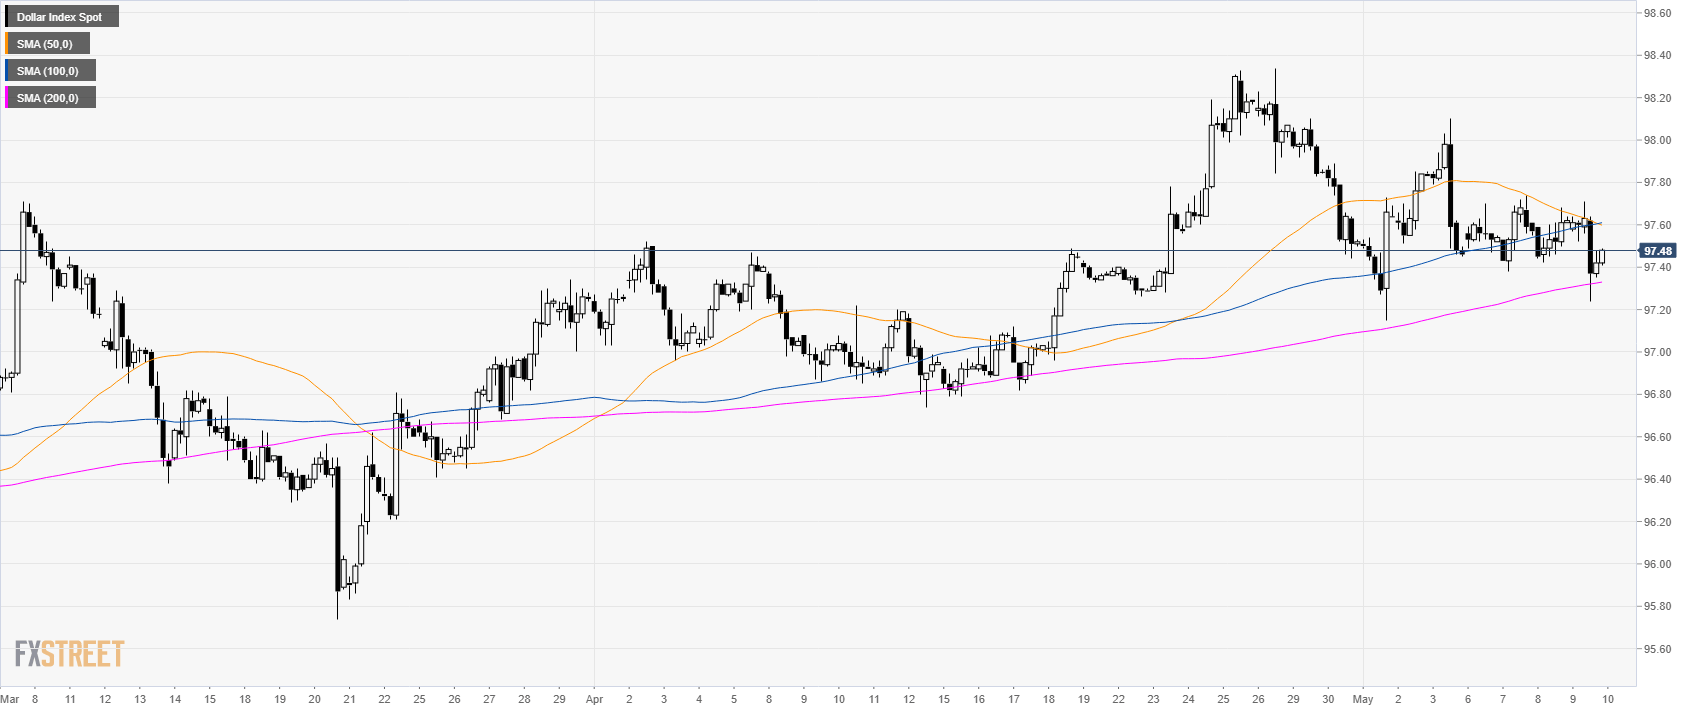
DXY 4-hour chart
DXY had a quick sell-off on Thursday but the market seem to have found support above 97.20 and the 200 SMA.
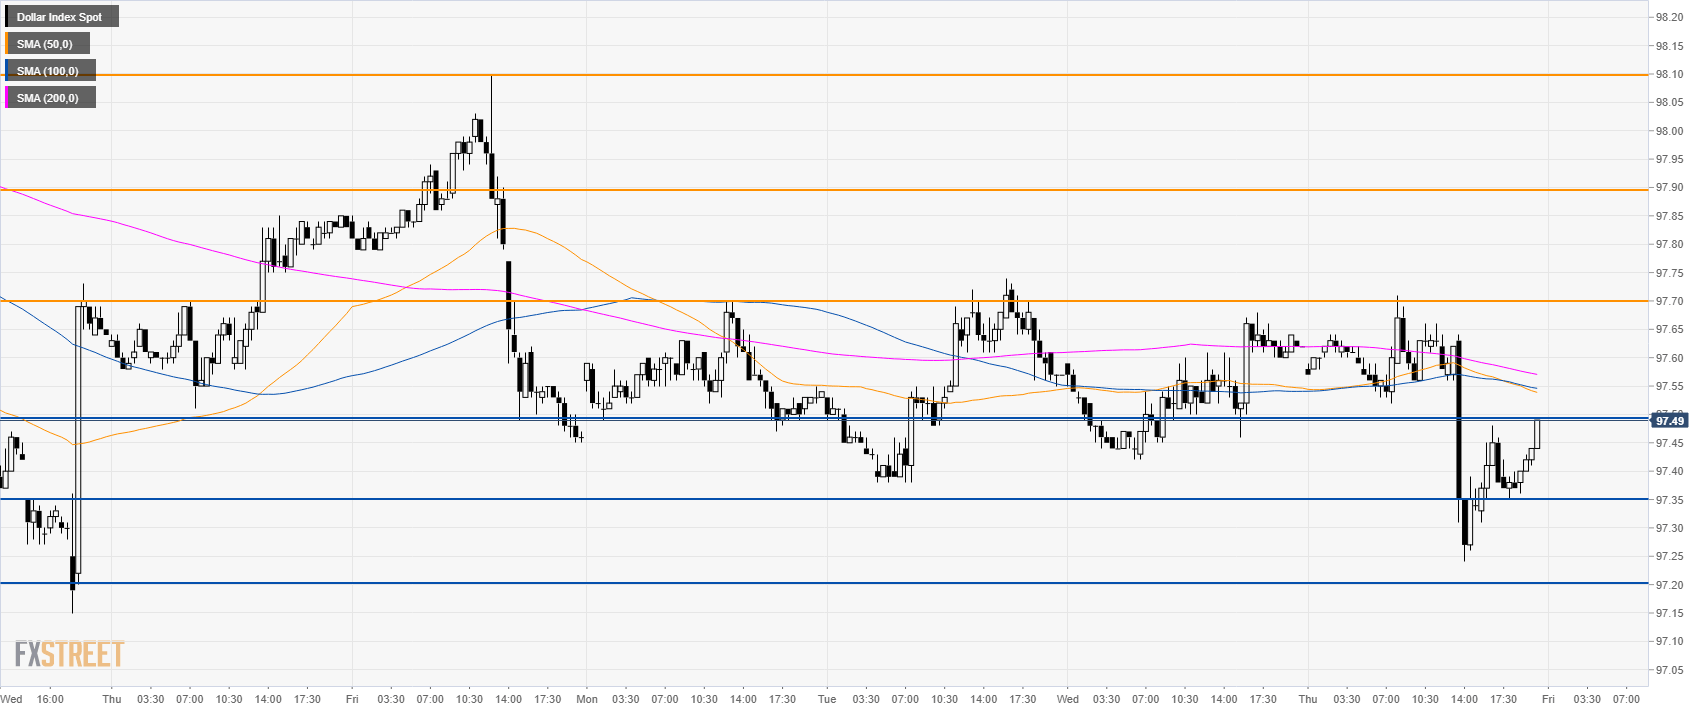
DXY 30-minute chart
A bullish break above 97.50 can see the index travel to 97.70, 97.90 and 98.10 level.
Support is seen at 97.35 and 97.20 level.
Additional key levels
