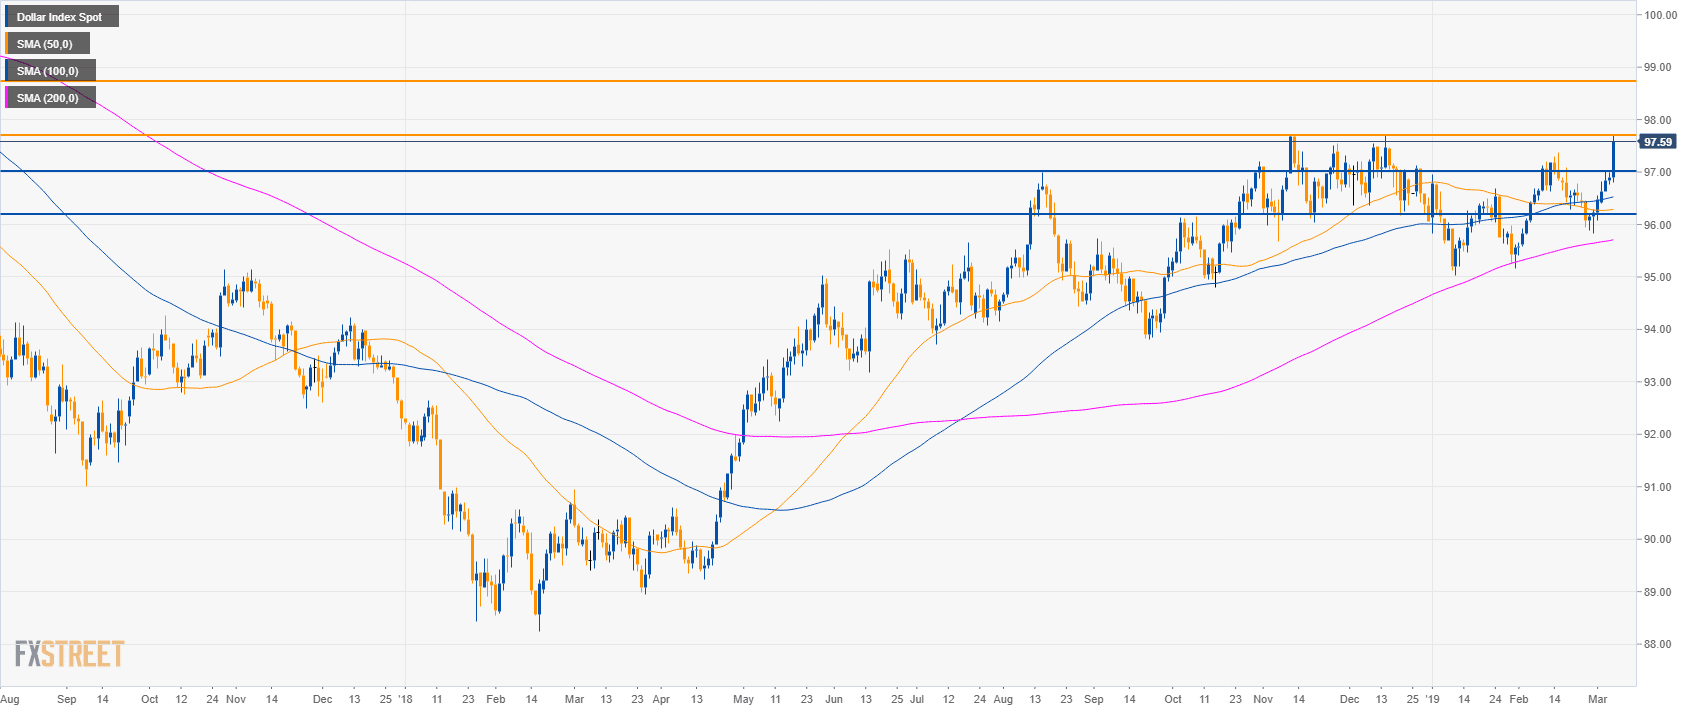
DXY daily chart
- The US Dollar Index (DXY) is trading in a bull trend above its main simple moving averages (SMAs).
- DXY reached a new 2019 high and a move beyond 97.71 resistance could lead to 98.72 level.
- Supports to the downside are seen at 97.00 and 96.10 level.
Additional key levels
Dollar Index Spot
Overview:
Today Last Price: 97.59
Today Daily change: 70 pips
Today Daily change %: 0.72%
Today Daily Open: 96.89
Trends:
Daily SMA20: 96.64
Daily SMA50: 96.28
Daily SMA100: 96.51
Daily SMA200: 95.69
Levels:
Previous Daily High: 96.99
Previous Daily Low: 96.77
Previous Weekly High: 96.61
Previous Weekly Low: 95.82
Previous Monthly High: 97.37
Previous Monthly Low: 95.4
Daily Fibonacci 38.2%: 96.91
Daily Fibonacci 61.8%: 96.85
Daily Pivot Point S1: 96.78
Daily Pivot Point S2: 96.66
Daily Pivot Point S3: 96.56
Daily Pivot Point R1: 97
Daily Pivot Point R2: 97.1
Daily Pivot Point R3: 97.22
