- DXY (US Dollar Index) is down for the third consecutive day after hitting a new 2019 high on Tuesday.
- The levels to beat for sellers are the 98.20 and 97.90 support levels.
- The United States Non-Manufacturing PMI came in at 56.4 in August vs. 54 expected.
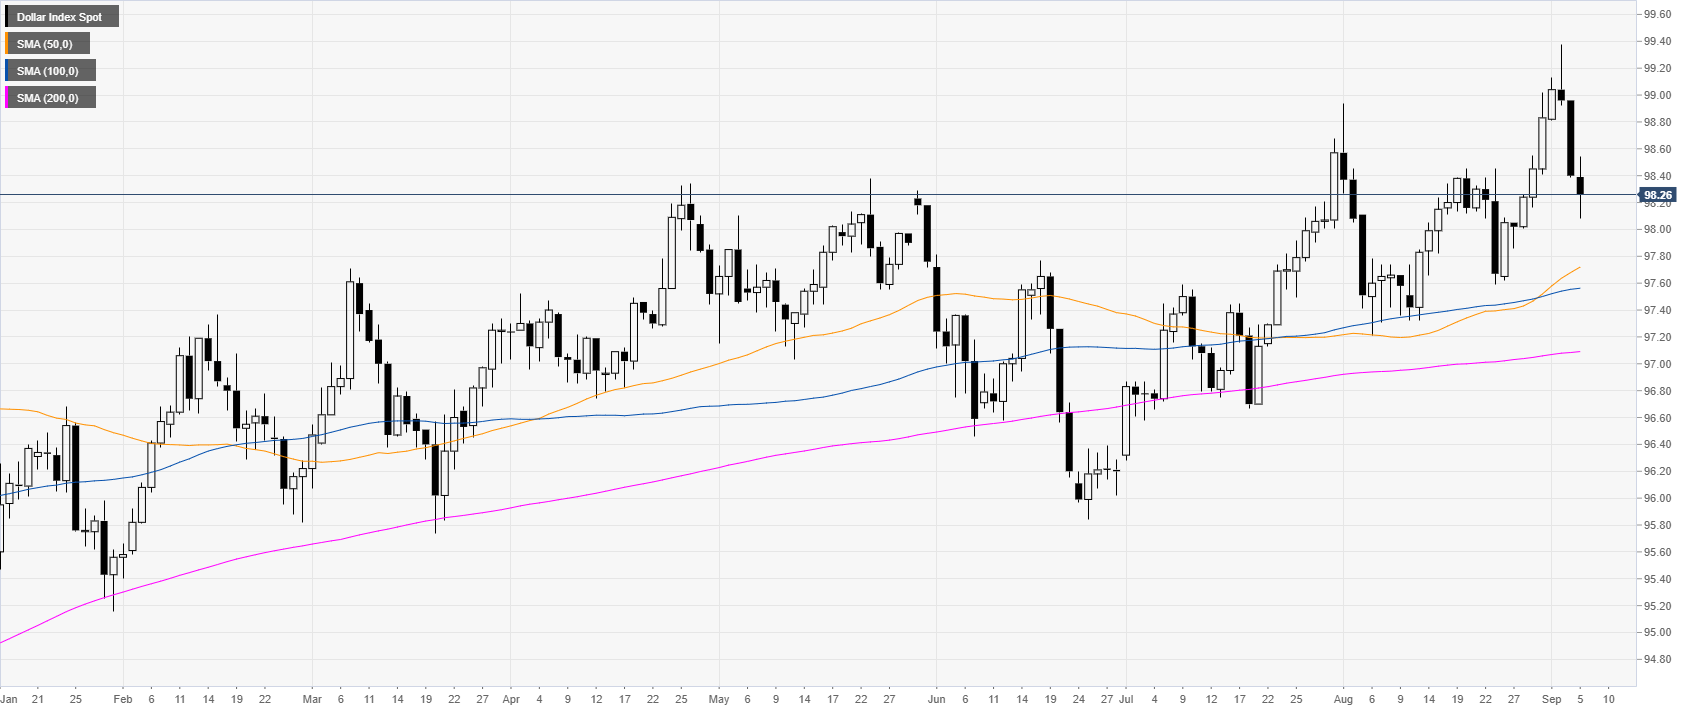
DXY daily chart
DXY (US Dollar Index) is trading in a bull trend above the main daily simple moving averages (DSMAs). DXY is having a sharp correcting down after hitting a new 2019 high on Tuesday. The United States Non-Manufacturing PMI came in at 56.4 in August vs. 54 expected.
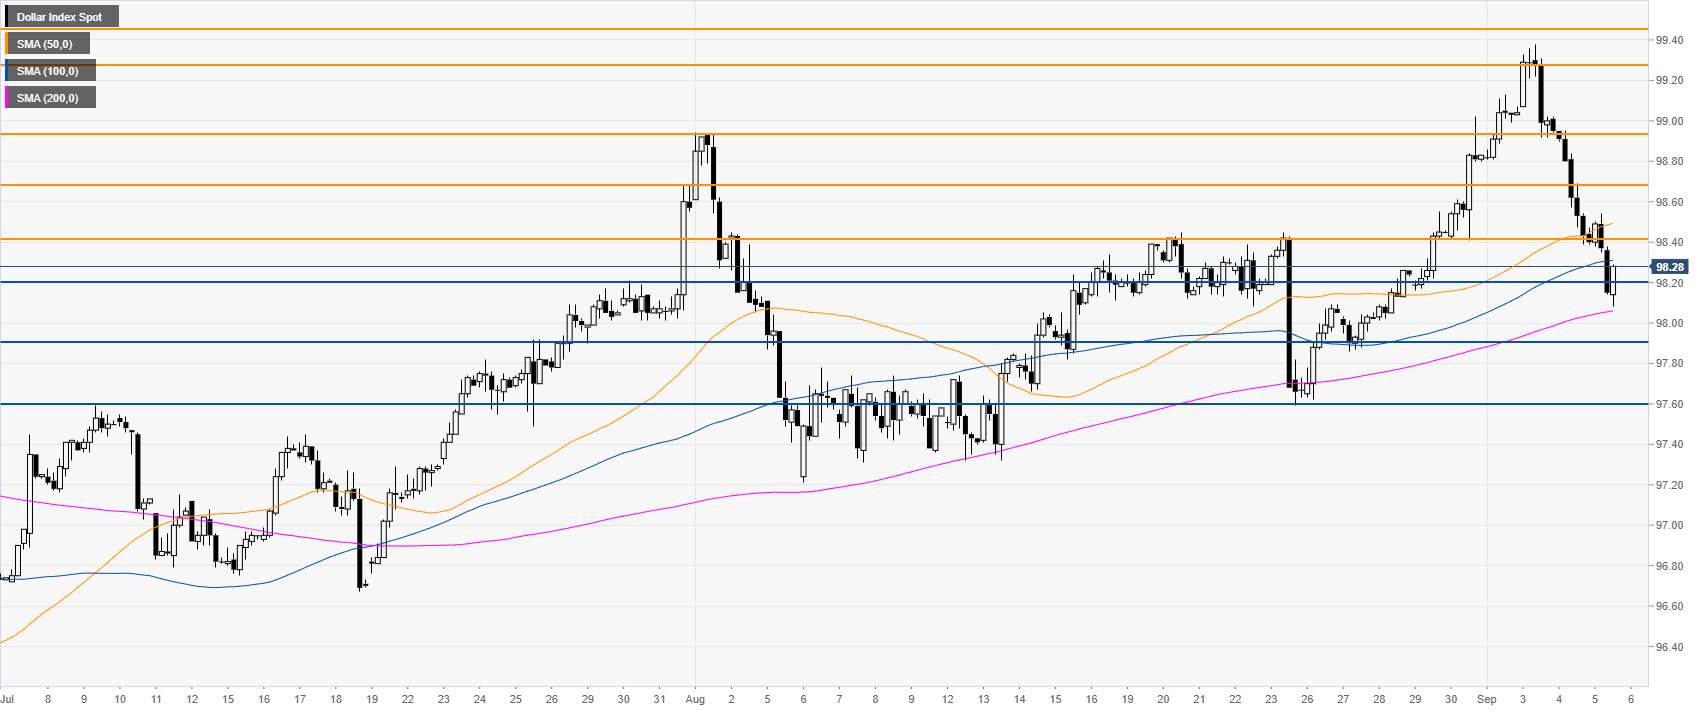
DXY four-hour chart
The Greenback is under bearish pressure below the 98.42 resistance and the 50/100 SMAs. If sellers bring the market below the 98.20 level, it can open the doors to further losses towards 97.90 and 97.60 support levels in the medium term.
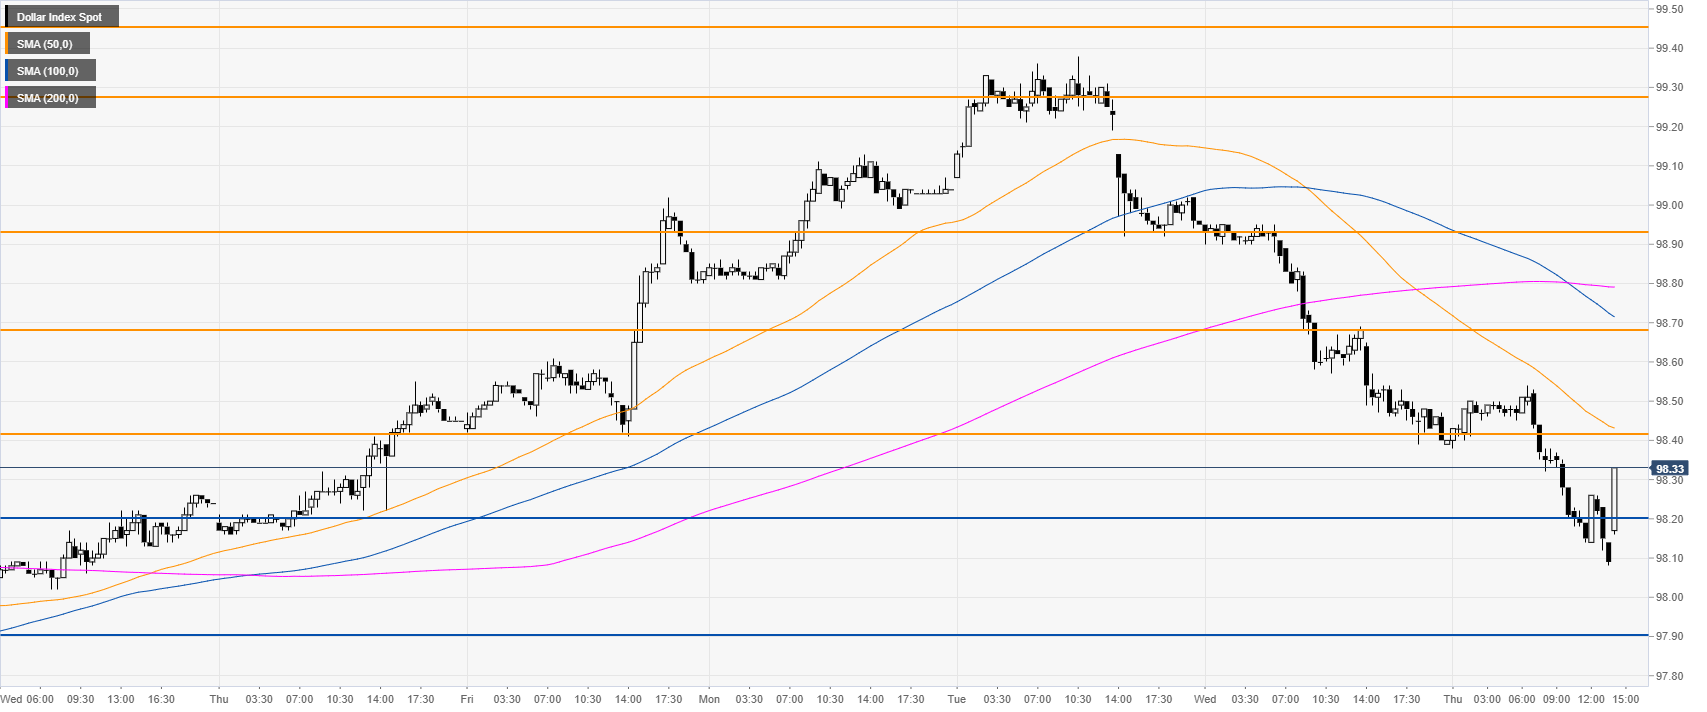
DXY 30-minute chart
DXY is trading below the main SMAs, suggesting bearish momentum in the near term. Immediate resistances can be seen at the 98.42 and 98.68 levels. The market is reacting up after the US Non-Manufacturing PMI came in at 56.4 in August vs. 54 expected. If the market surpasses 98.42 it can question the bearish correction.
Additional key levels
