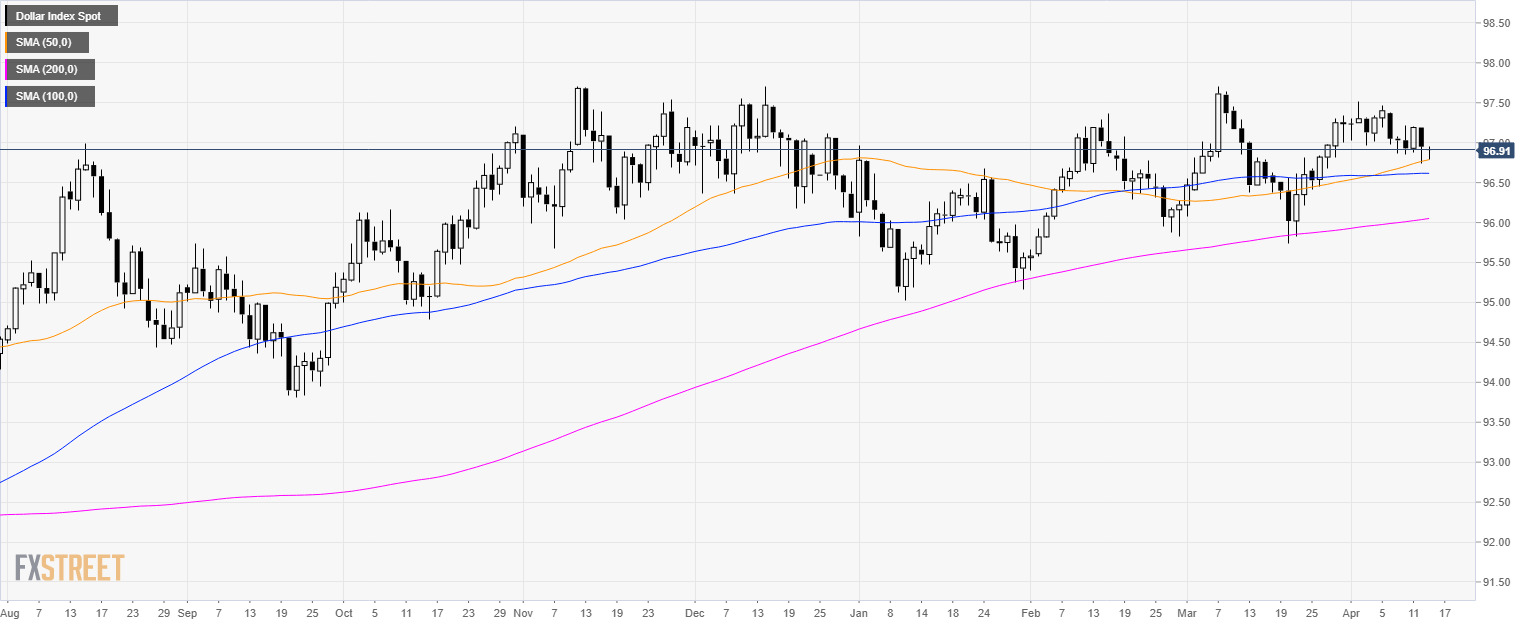
Home US Dollar Index Technical Analysis: DXY remains supported above 96.80 level
FXStreet News

US Dollar Index Technical Analysis: DXY remains supported above 96.80 level

DXY daily chart

  • The US Dollar Index (DXY) is trading in a bull trend above its 200-day simple moving average (SMA).
  • DXY found some support at the 50 SMA just below 97.00 the figure.
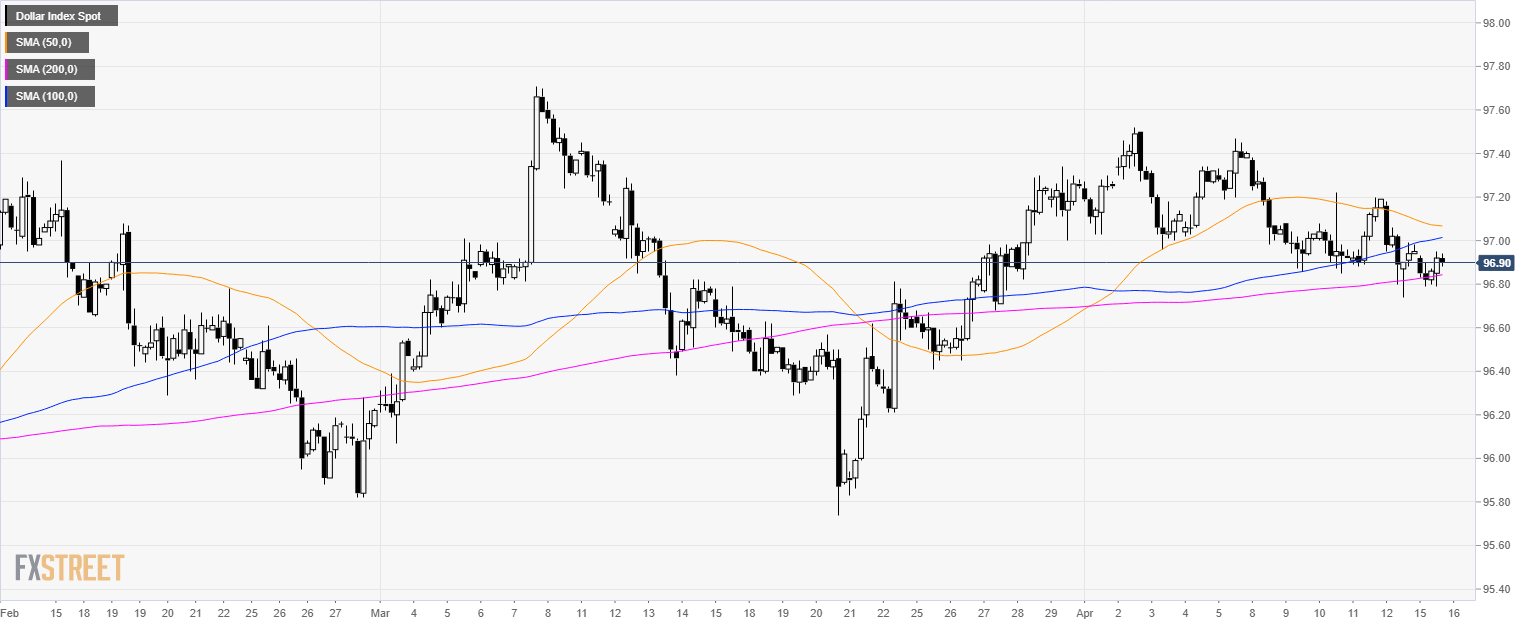

DXY 4-hour chart

  • DXY found some support at the 200 SMA.
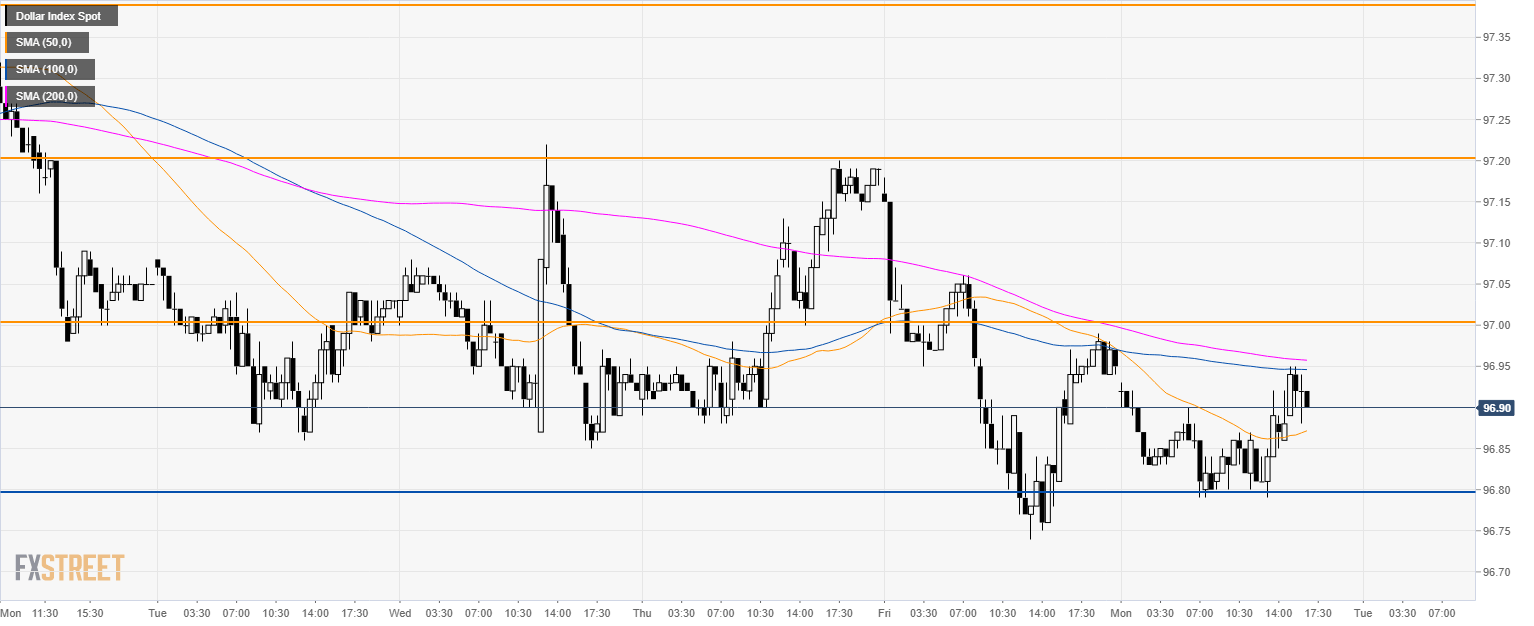

DXY 30-minute chart

  • The level to beat for bulls is the 97.00 figure. A bullish break above the resistance would open the gates to 97.20 and 97.40 level.  
  • Supports to the downside are  at 96.80 and 96.60 level.

Additional key levels


FX Street

FX Street

FXStreet is the leading independent portal dedicated to the Foreign Exchange (Forex) market. It was launched in 2000 and the portal has always been proud of their unyielding commitment to provide objective and unbiased information, to enable their users to take better and more confident decisions.