-
DXY (US Dollar Index) is recovering after the sharp Friday’s decline.
-
The levels to beat for bears are at 97.95 and 97.85.
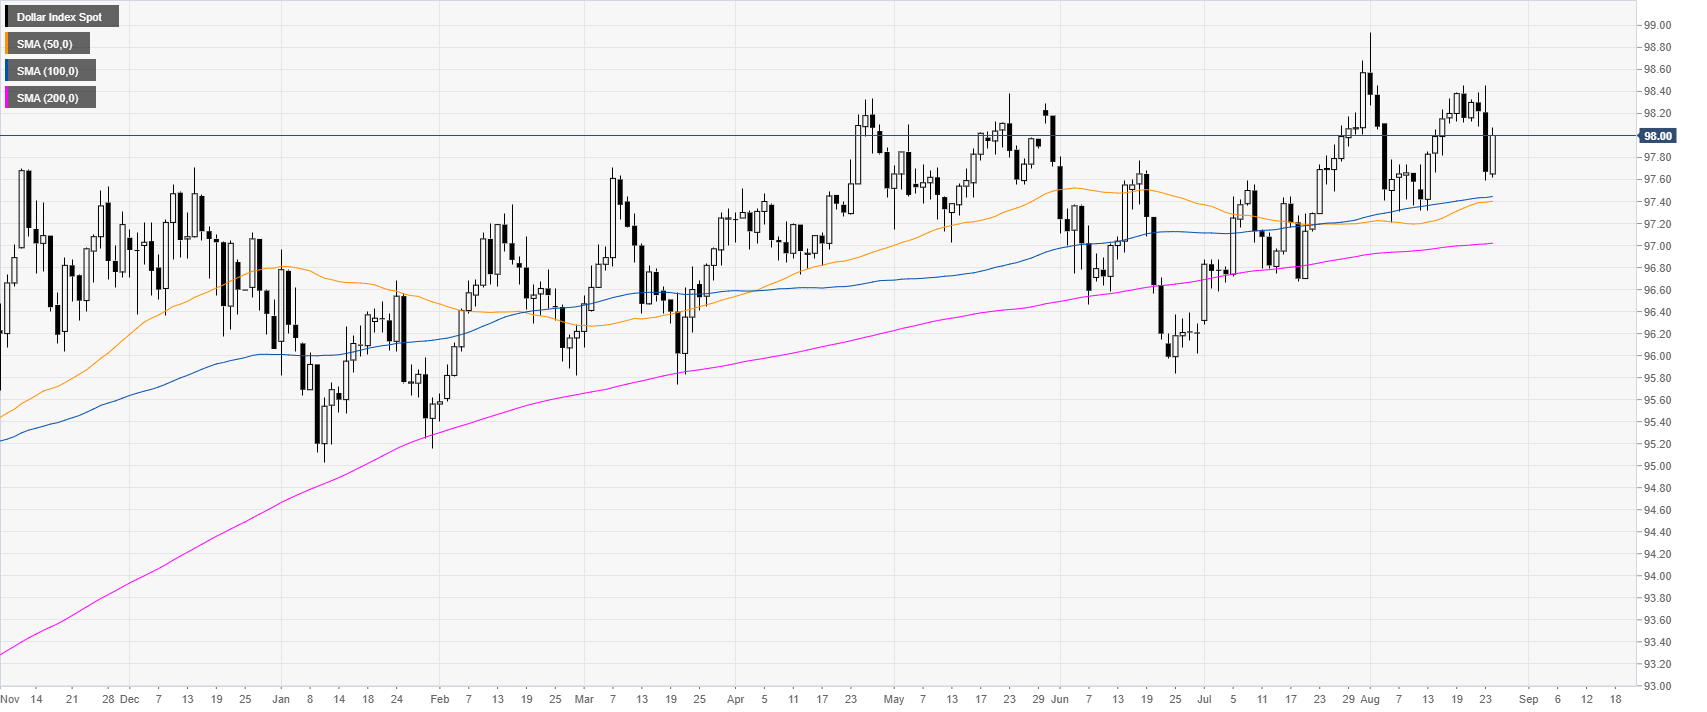
DXY daily chart
DXY (US Dollar Index) trading in a bull trend above the main daily simple moving averages (DSMAs). The market is consolidating the sharp drop seen last Friday.
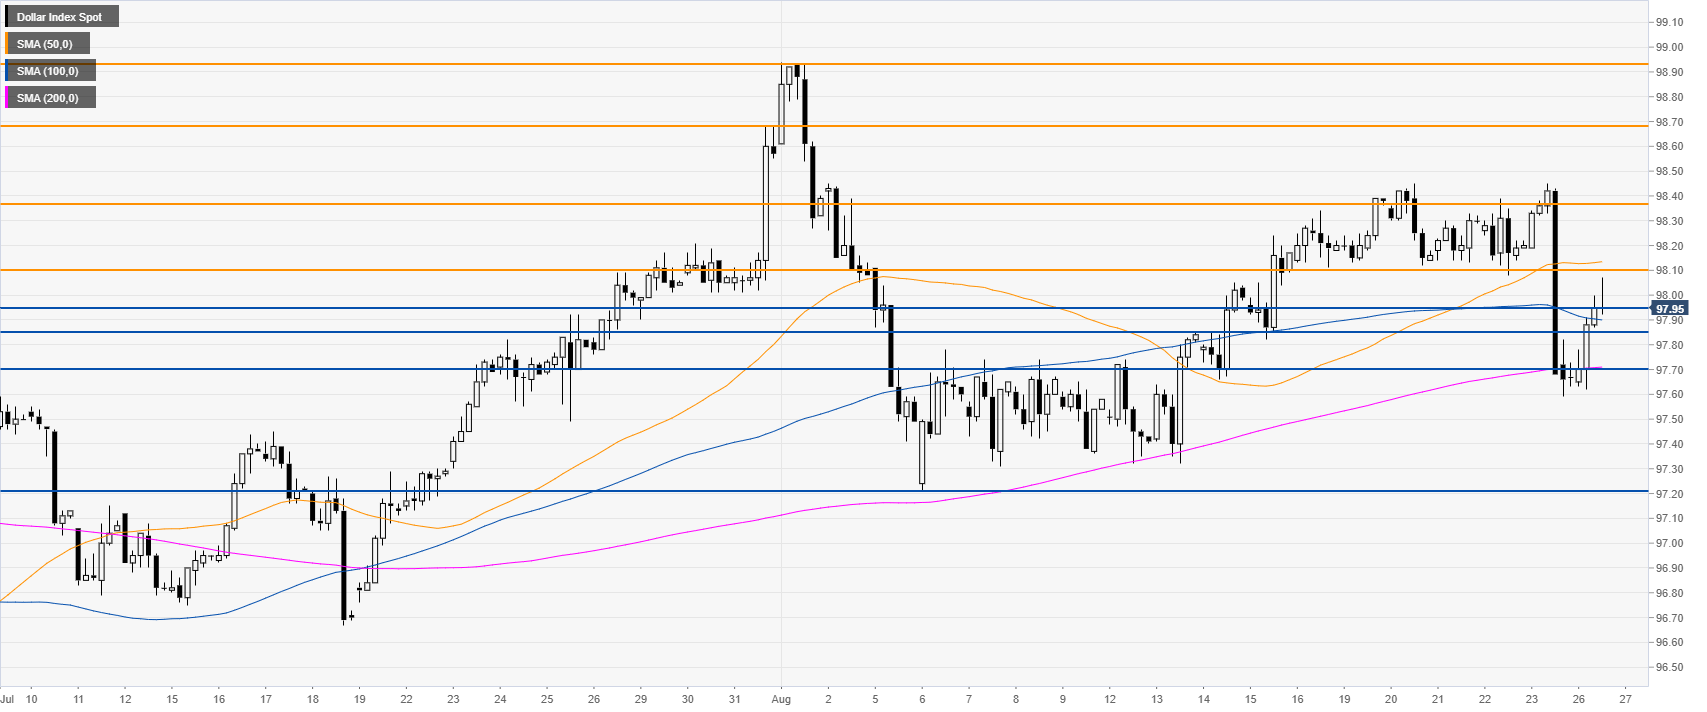
DXY 4-hour chart
DXY remains under pressure below 98.10 and the 50 SMA. Bears will need to clear 97.95/85 and 97.70 support if they want to create a meaningful breakdown towards the 97.20 level.
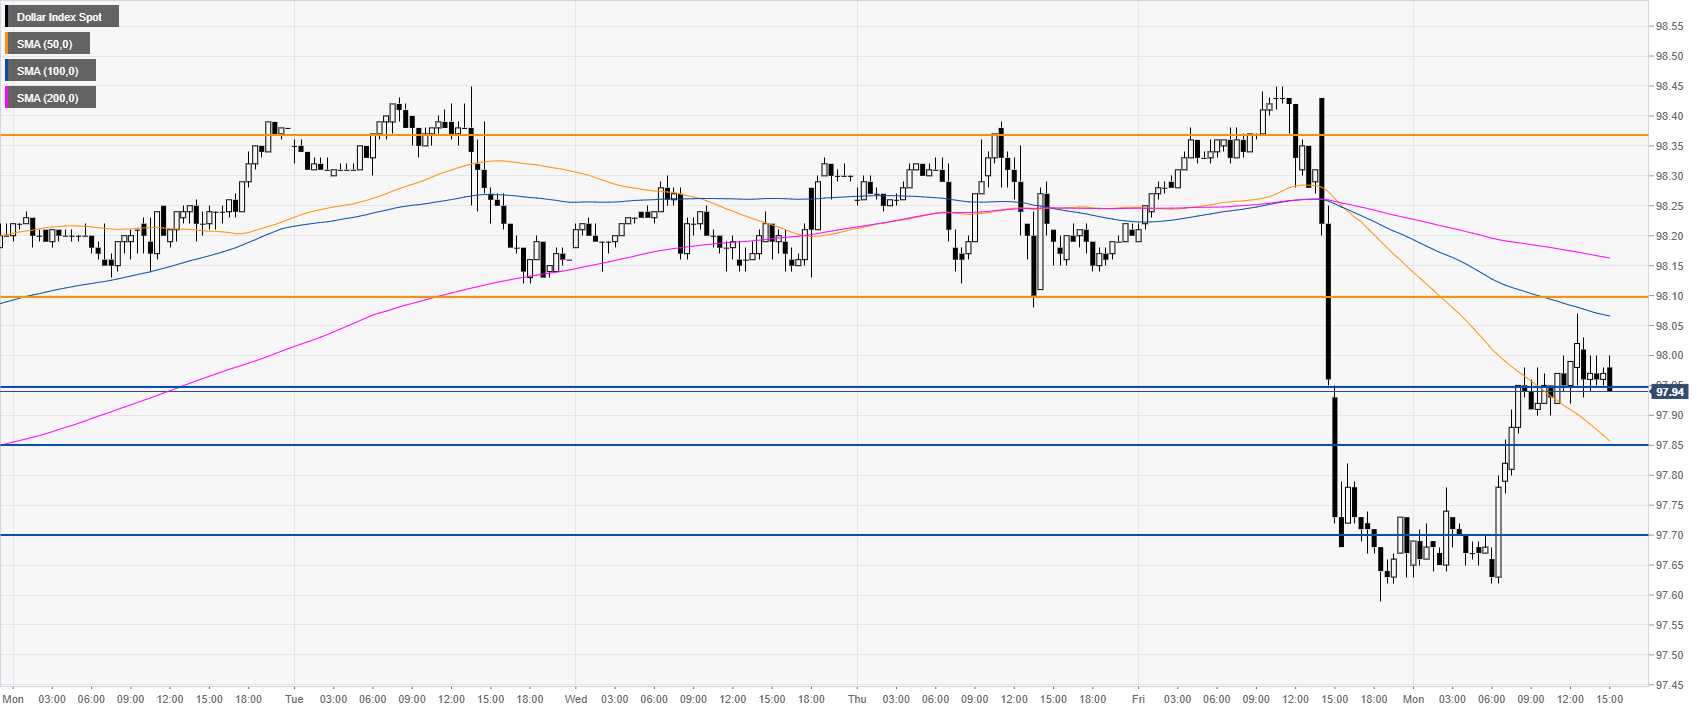
DXY 30-minute chart
The Greenback is trading below a downward sloping 100/200 SMAs, suggesting bearish momentum in the short term. The main resistance to break for bulls is the 98.10 level.
Additional key levels
