- US data weakened the US Dollar this Friday.
- DXY is challenging the 99.10 support level below the 2019 low.
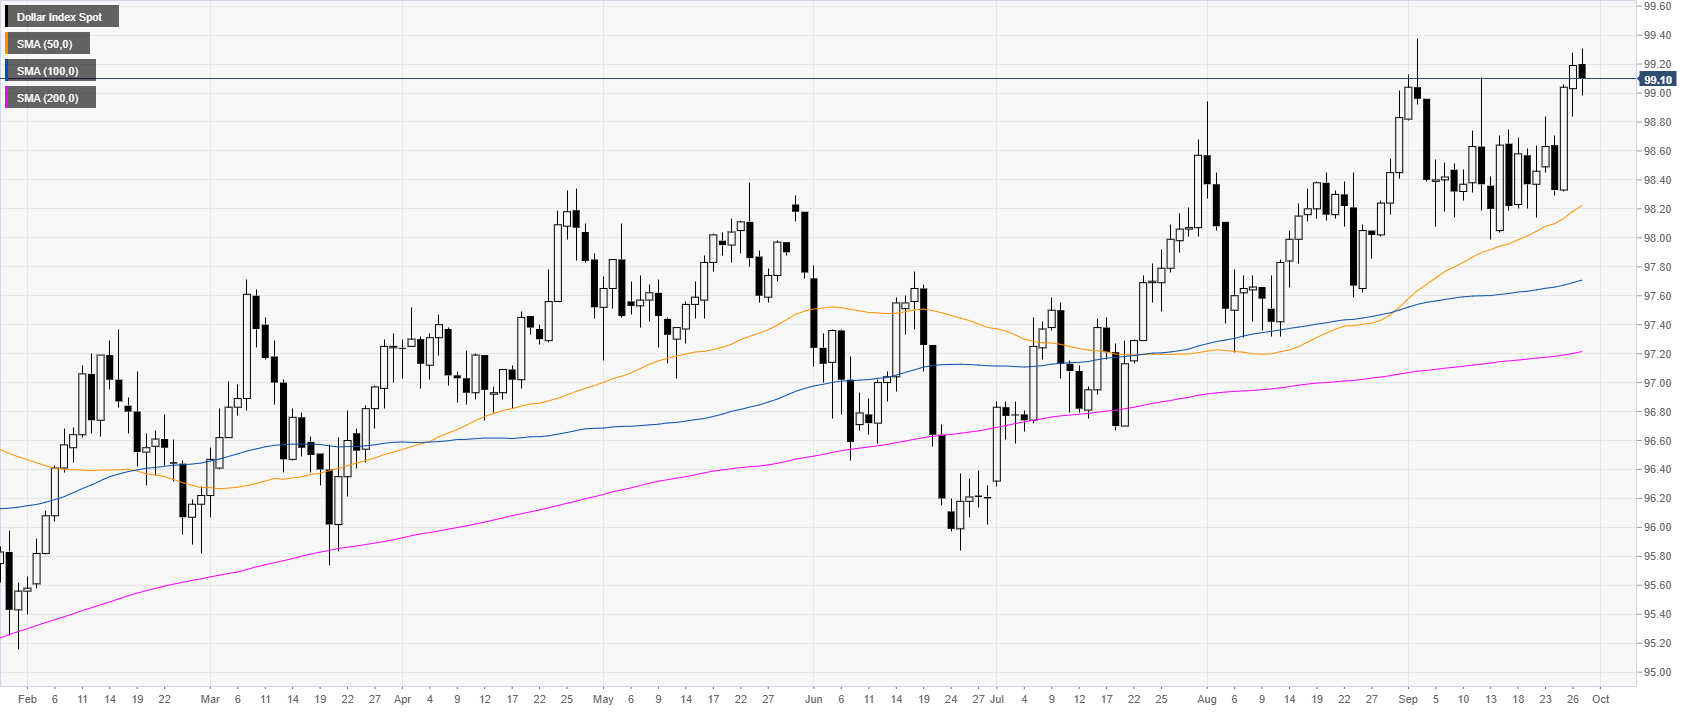
DXY daily chart
DXY (US Dollar Index) is trading a bull trend above its main daily simple moving averages (DSMAs). The market almost hit the 2019 high at 99.38 before retreating slightly. Earlier in the New York session, the Nondefense Capital Goods Orders Excluding Aircraft (August) in the United States, came in below expectations at -0.2 vs. 0% while the Core Personal Consumption Expenditure YoY came in line with expectations at 1.8% in August.
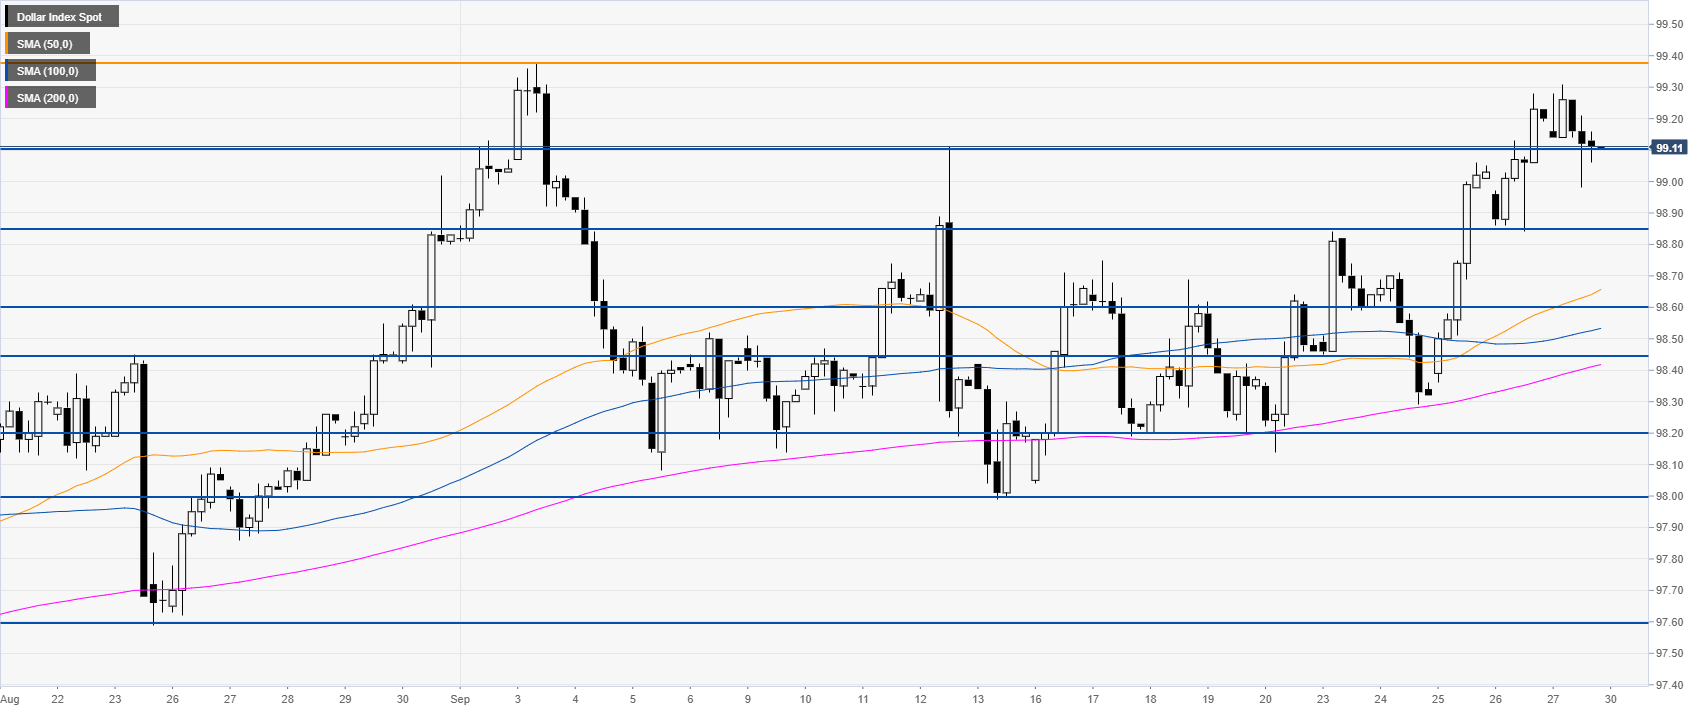
DXY four-hour chart
DXY is pulling back down before hitting the 2019 high at 99.38. The market is challenging the 99.10 support. A break below 99.10 can expose 98.85 on the way down.
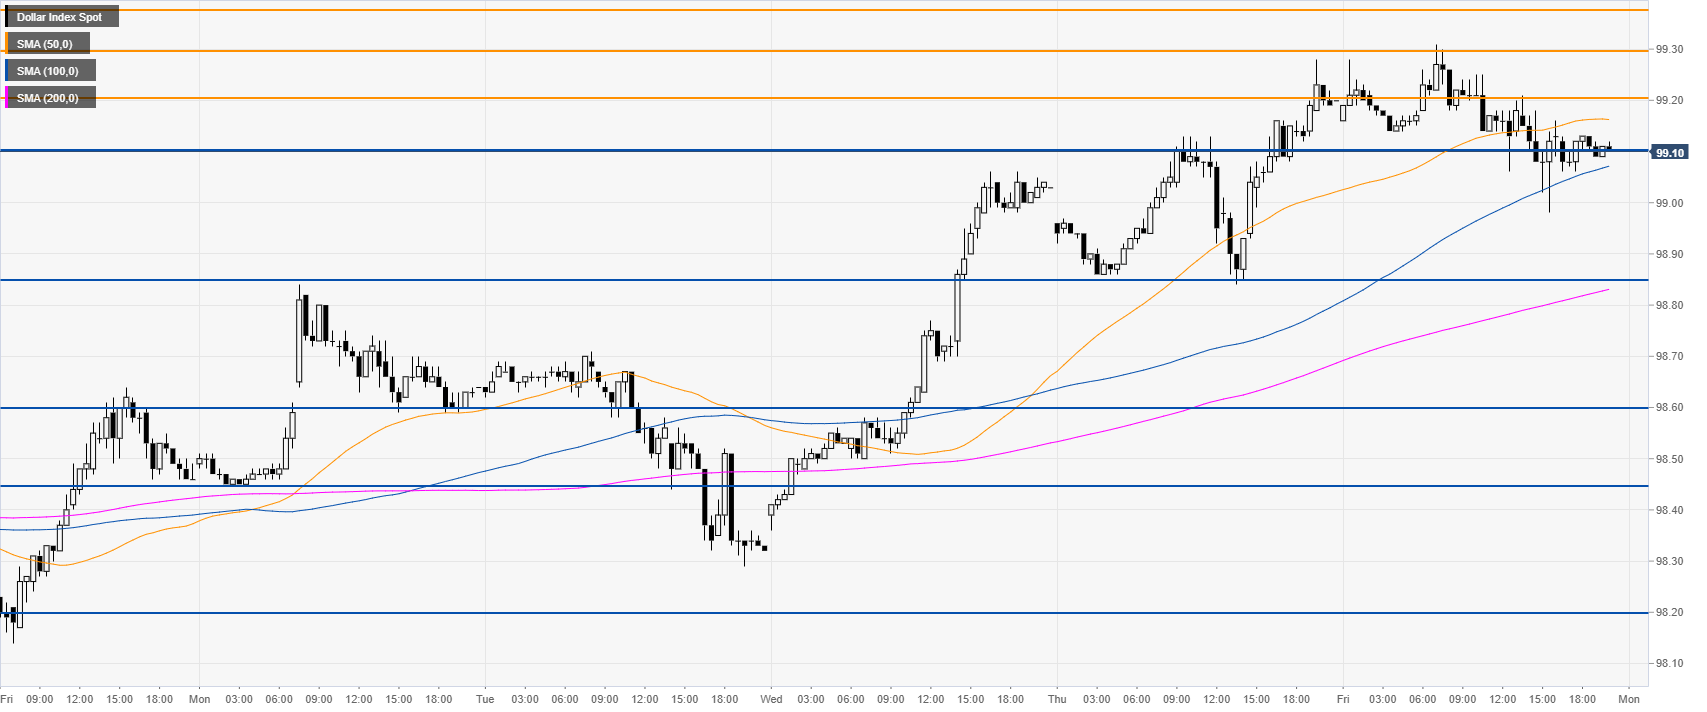
DXY 30-minute chart
DXY is challenging the 99.10 support and the 100 SMA, suggesting a neutral bias in the short term. Immediate resistance is seen at the 99.20/30 resistance zone.
Additional key levels
