- DXY is ending Thursday at four-day lows.
- Support is seen at the 98.10 and 98.00 handle.
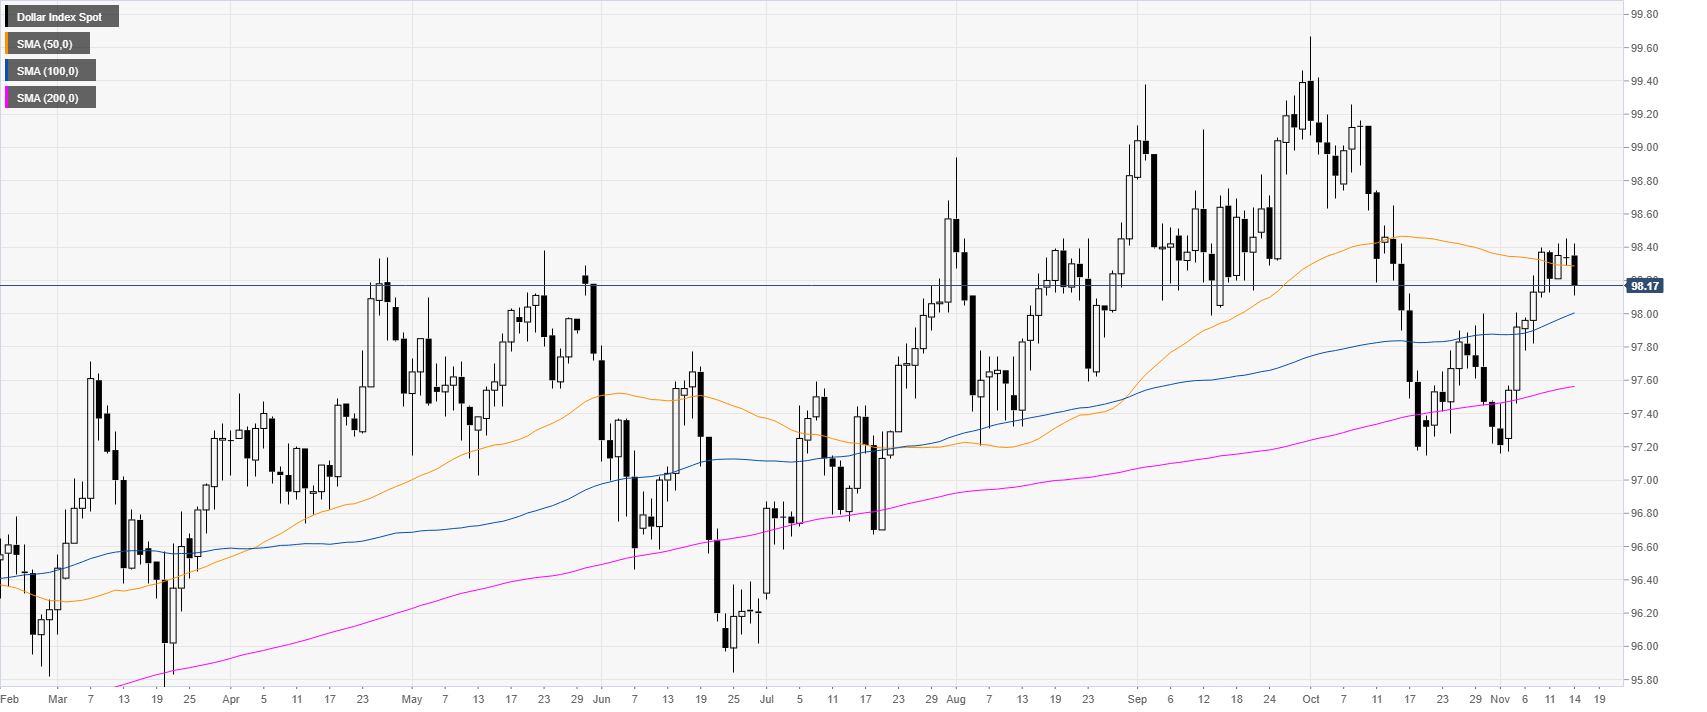
DXY daily chart
DXY (US Dollar Index) is trading in an uptrend above its main daily simple moving averages (DMAs). This Thursday the Greenback lost some traction and closed near 4-day lows.
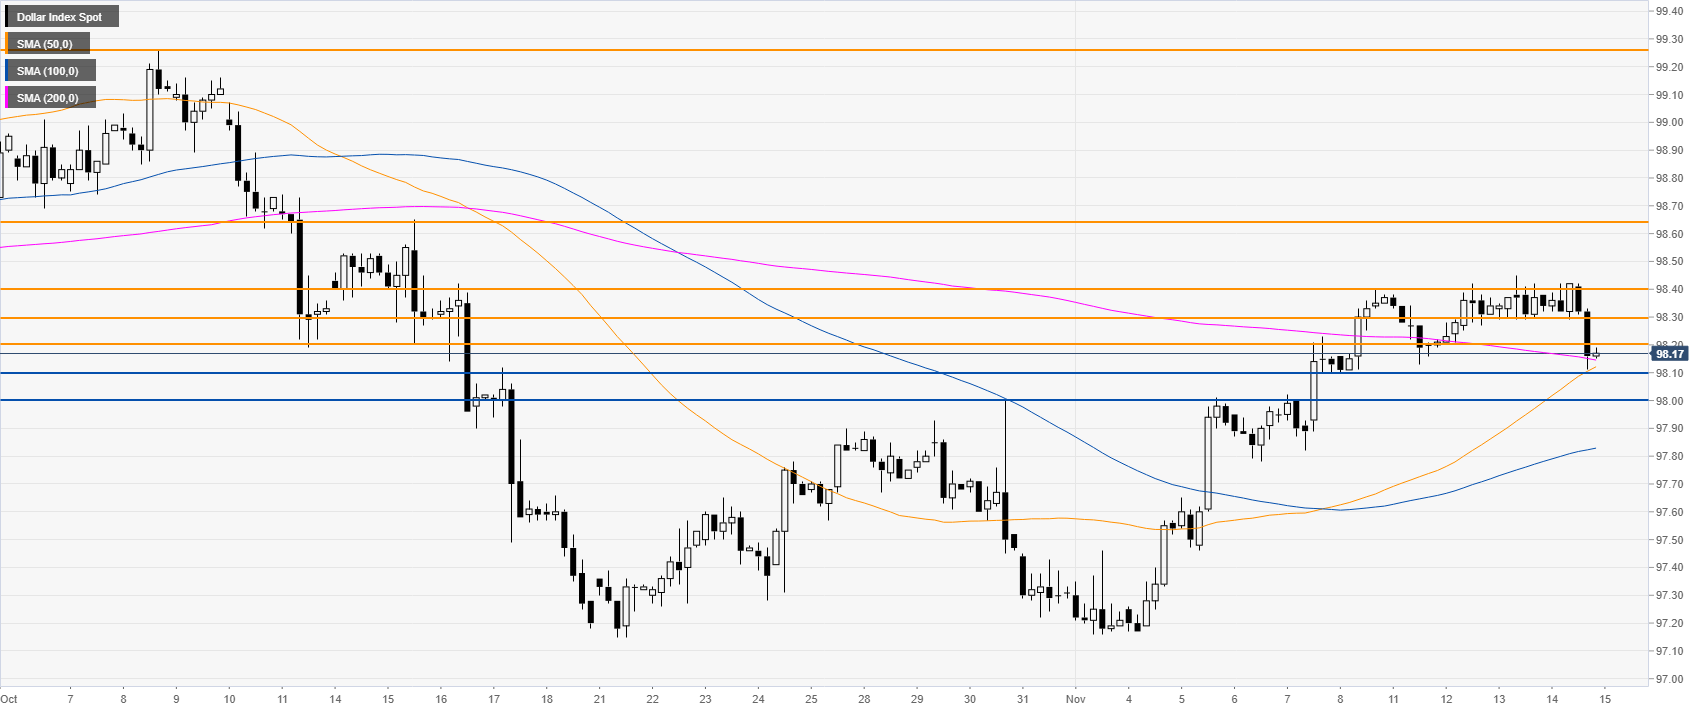
DXY 4-hour chart
DXY is challenging the 98.10 support level and the 200 SMA, on the four-hour chart. The trend is still to the upside. However, a dip to the 98.00 handle cannot be ruled out. A
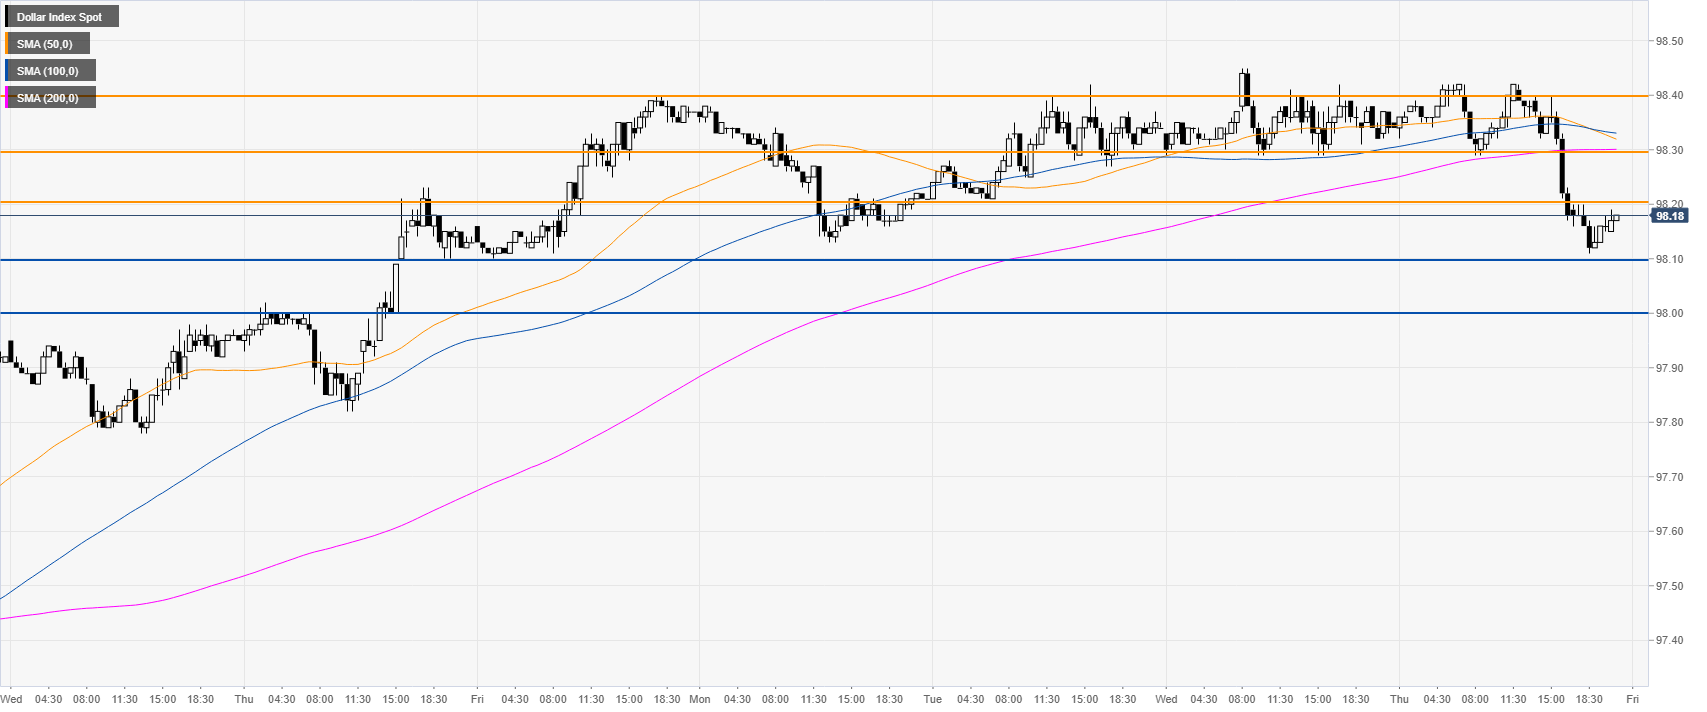
DXY 30-minute chart
DXY is trading below its main SMAs, suggesting a bearish bias in the short term. Resistance is seen at the 98.20, 98.30 and 98.40 levels.
Additional key levels
