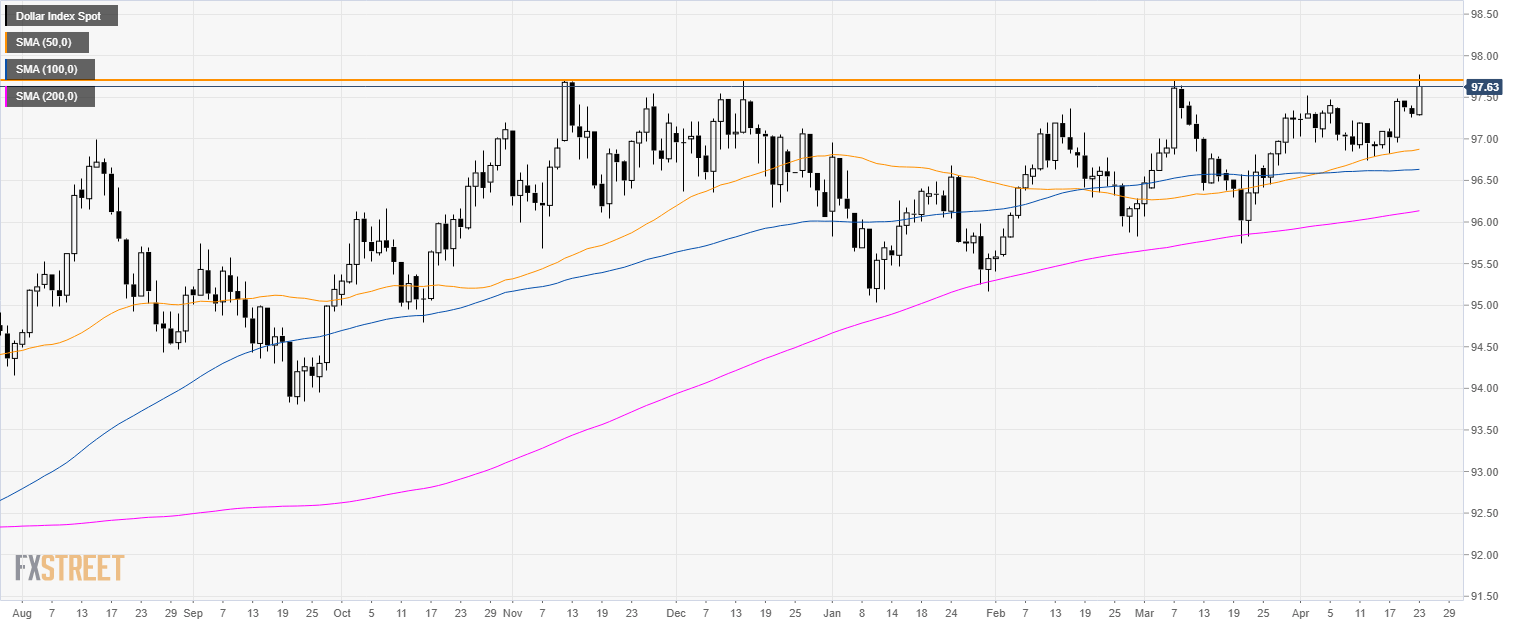
DXY daily chart
- The US Dollar Index (DXY) is trading in a bull trend above its 200-day simple moving average (SMA).
- DXY hit a new 2019 high at 97.78 during the North American session.
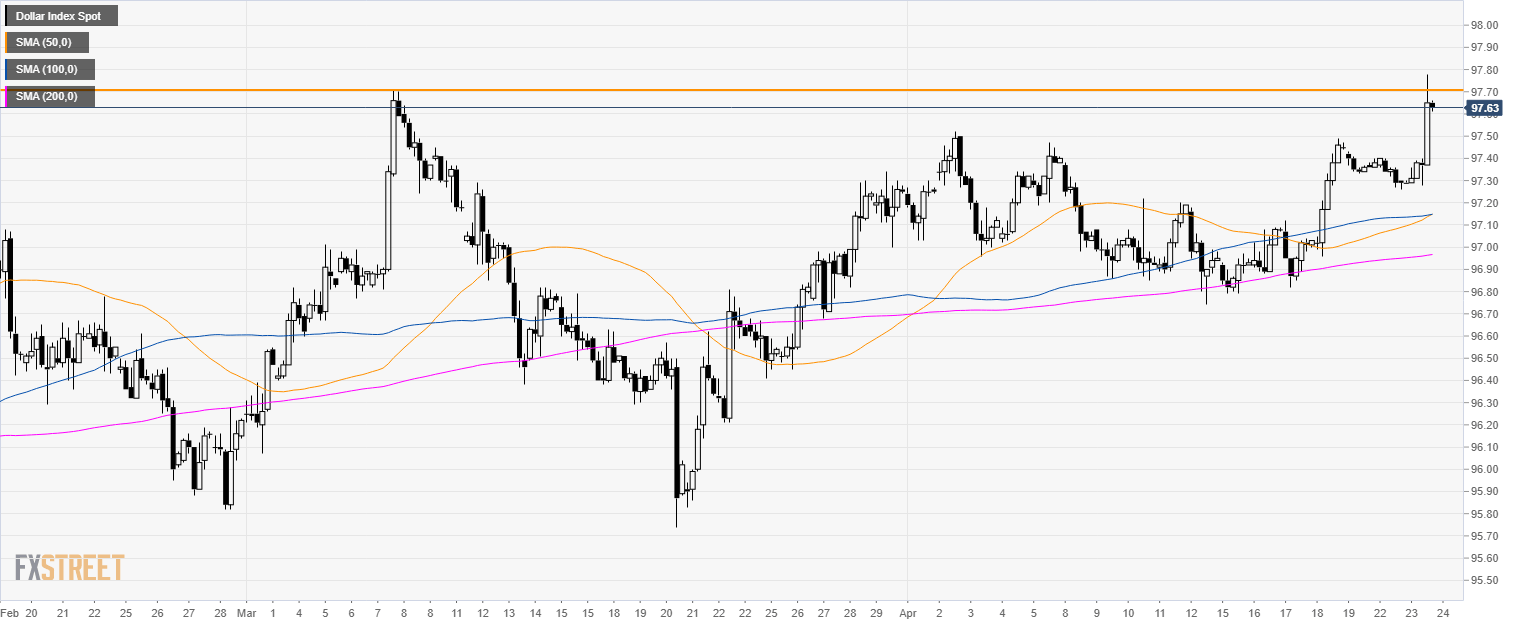
DXY 4-hour chart
- There is currently no acceptance above the 97.70 key resistance.
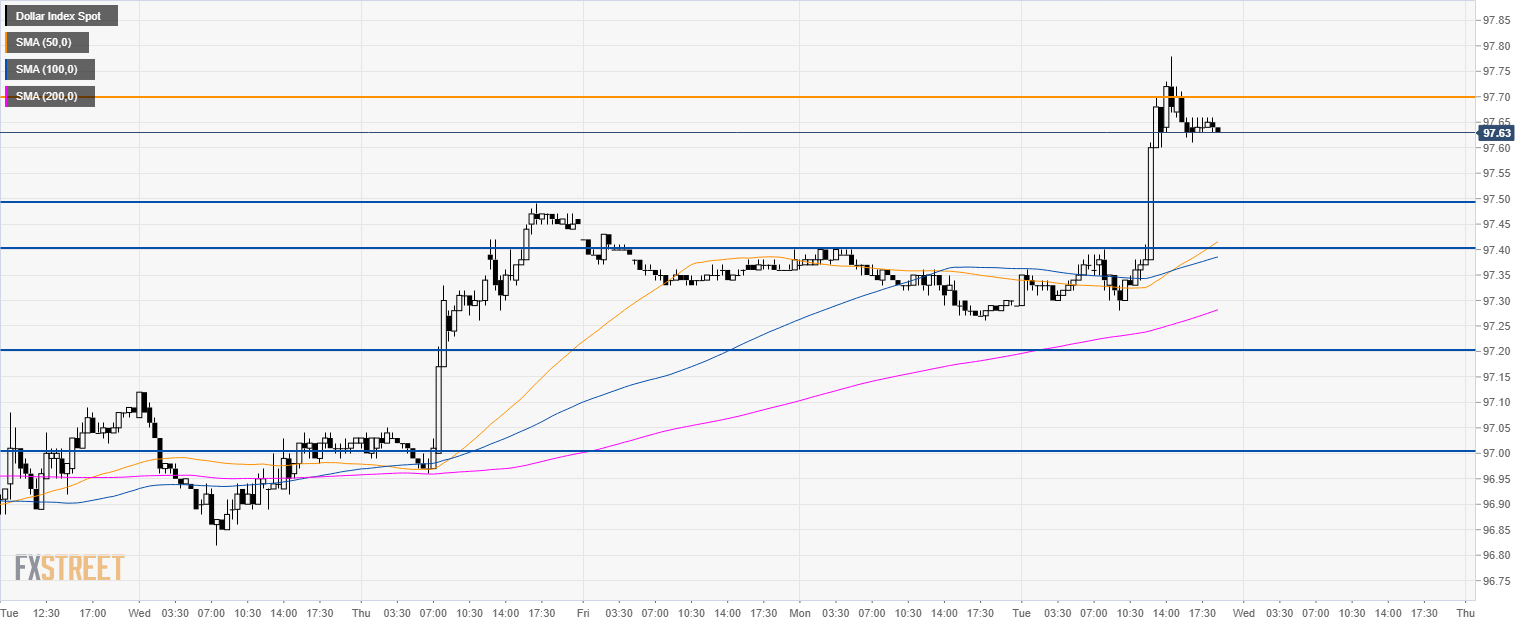
DXY 30-minute chart
- The momentum is bullish however bulls will need a convincing breakout above 97.70 resistance.
- Failure to retake that price level would see the current up move as a bullish overaction exposing 97.50/40 support to the downside.
- Alternatively, the bullish scenario would entail a break above 97.70 towards 98.00 resistances.
Additional key levels


