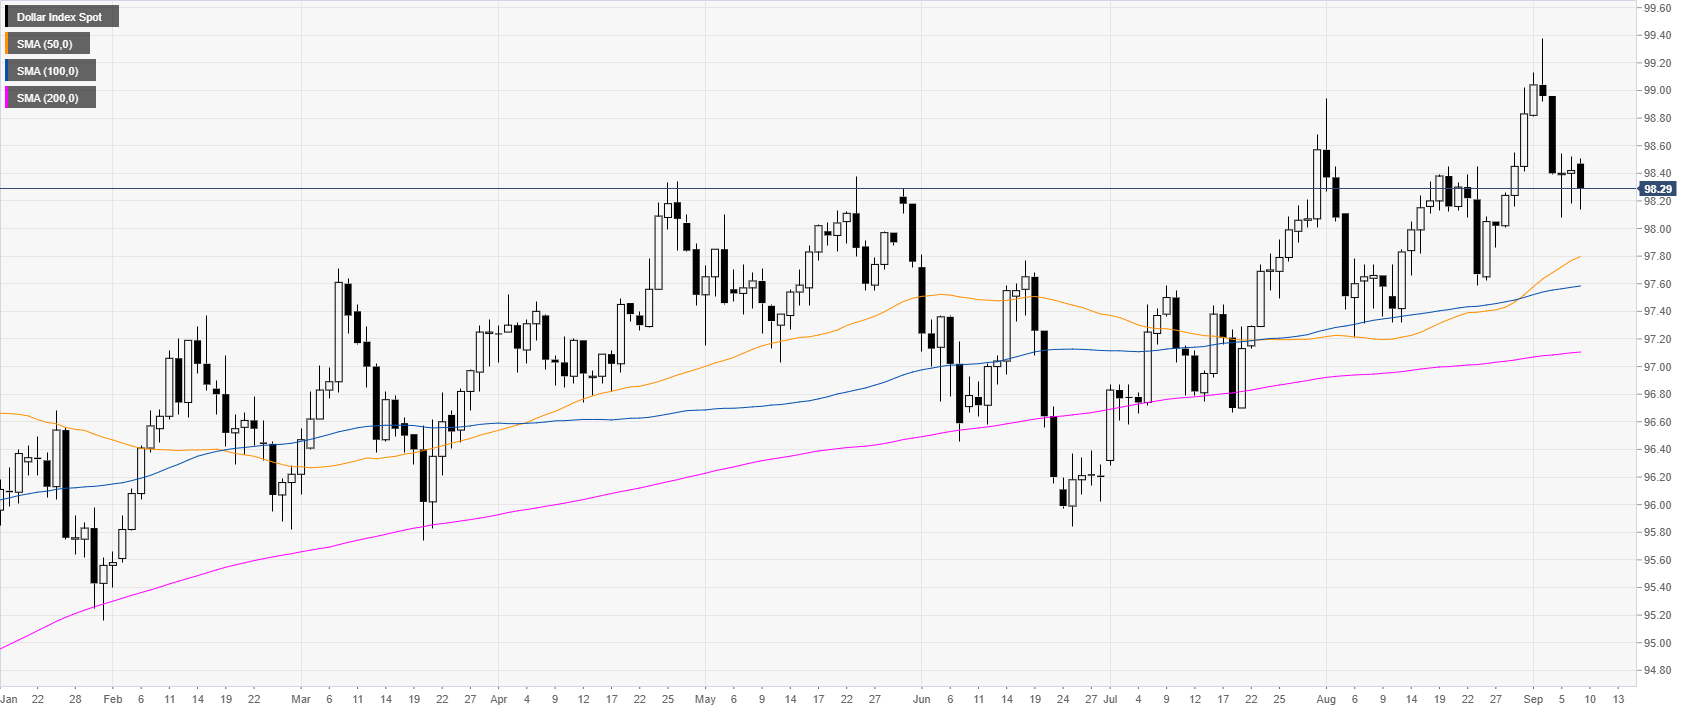
- DXY (US Dollar Index) stays confined in a tight range for the third consecutive day.
- The levels to beat for bulls is at the 98.42/55 resistance zone.
DXY daily chart
DXY (US Dollar Index) is trading in a bull trend above its main daily simple moving averages (DSMAs). The Greenback is ending its third day of consolidation in the 98.10/98.55 zone.
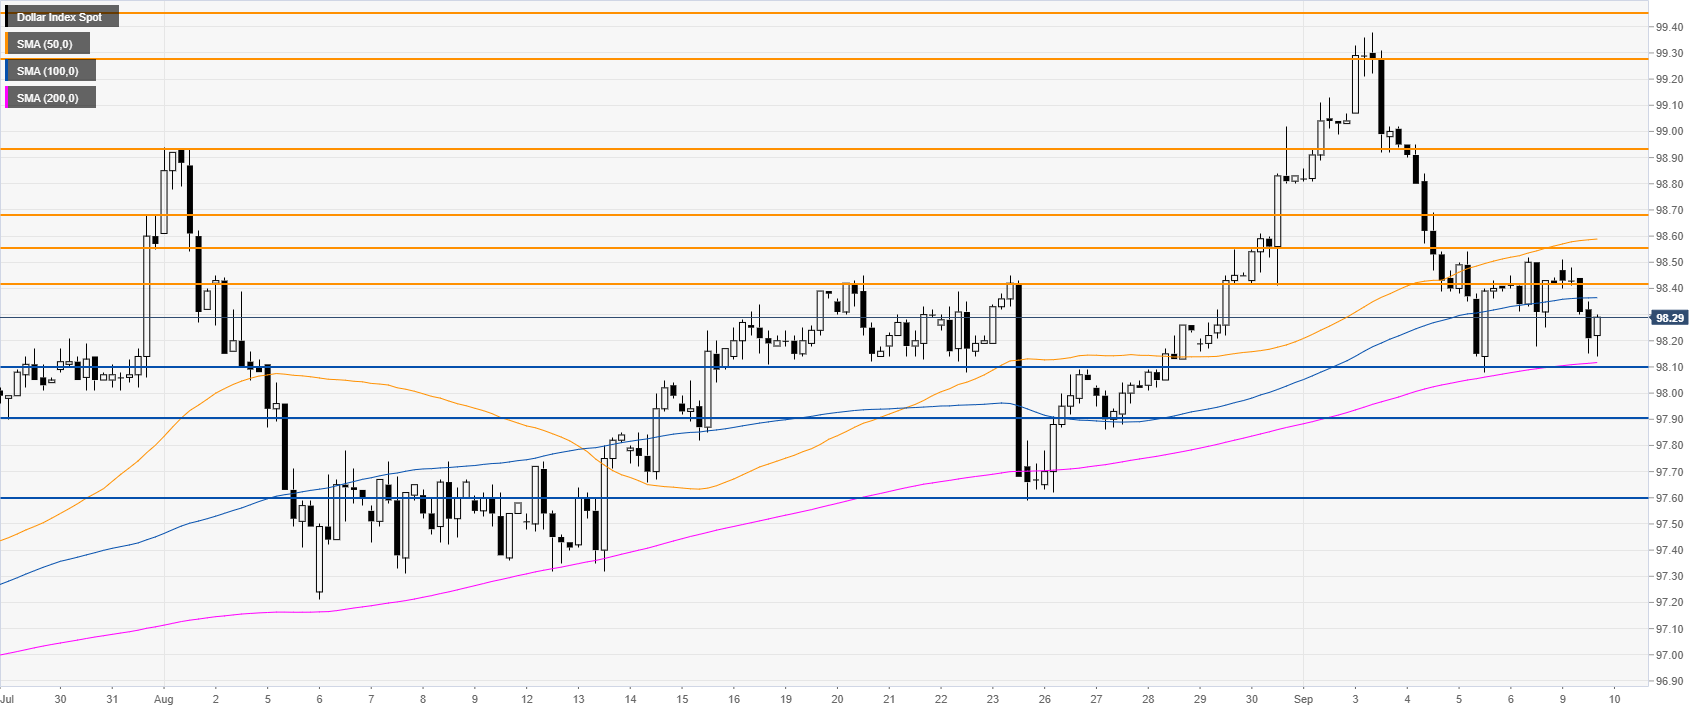
DXY four-hour chart
The Greenback is holding above the 98.10 support and the 200 SMA. DXY buyers need to overcome the 92.42/98.55 resistance zone to resume the bull trend towards the 98.68 and 98.94 price levels in the medium term.
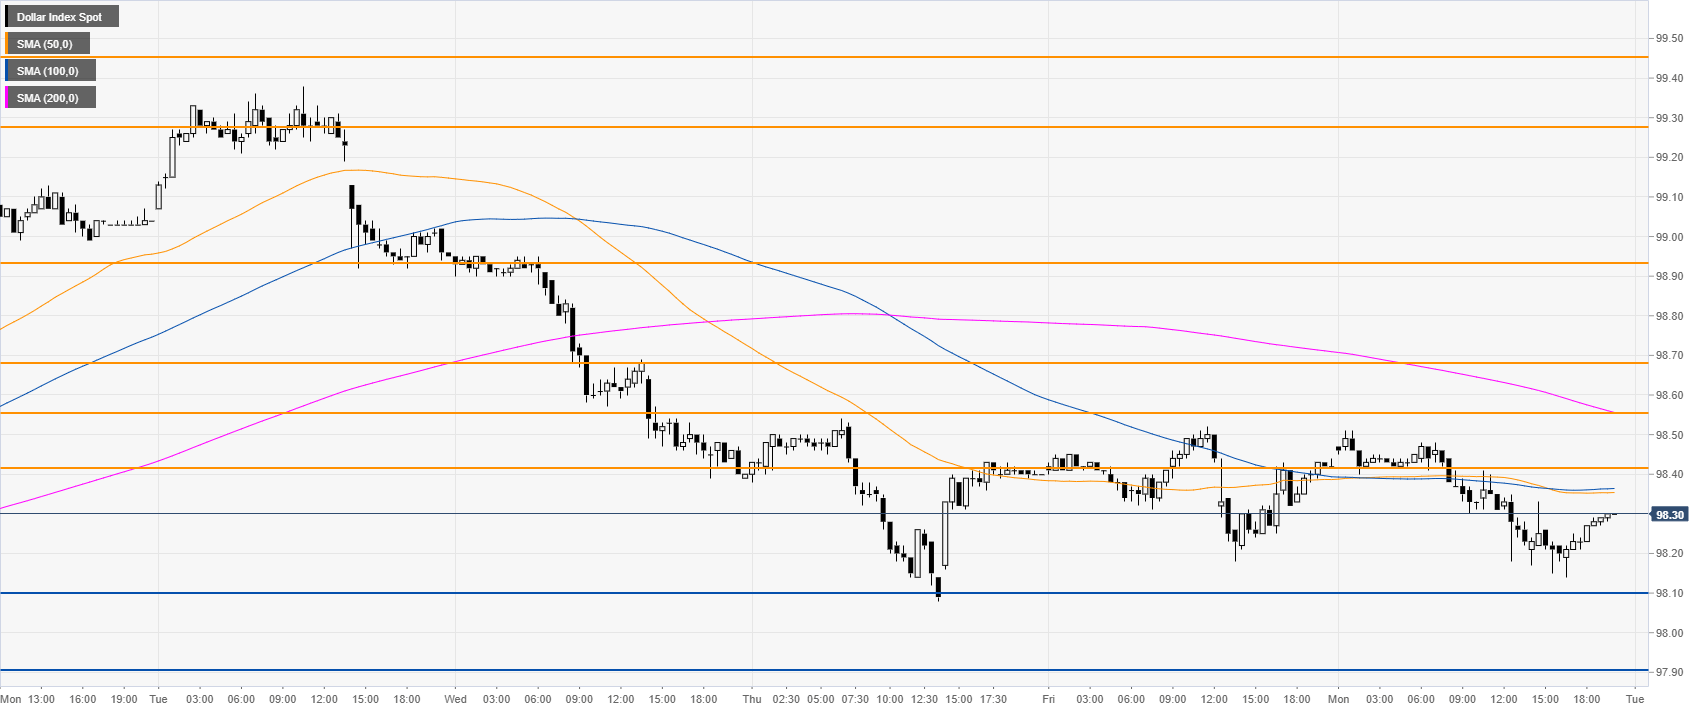
DXY 30-minute chart
DXY is trading below the main SMAs, suggesting bearish momentum in the near term. Immediate support is seen at the 98.10 level followed by 97.90 on the way down.
Additional key levels
