- DXY is continuing to correct down this Monday.
- The next key supports are seen at the 97.70 and 97.50 levels.
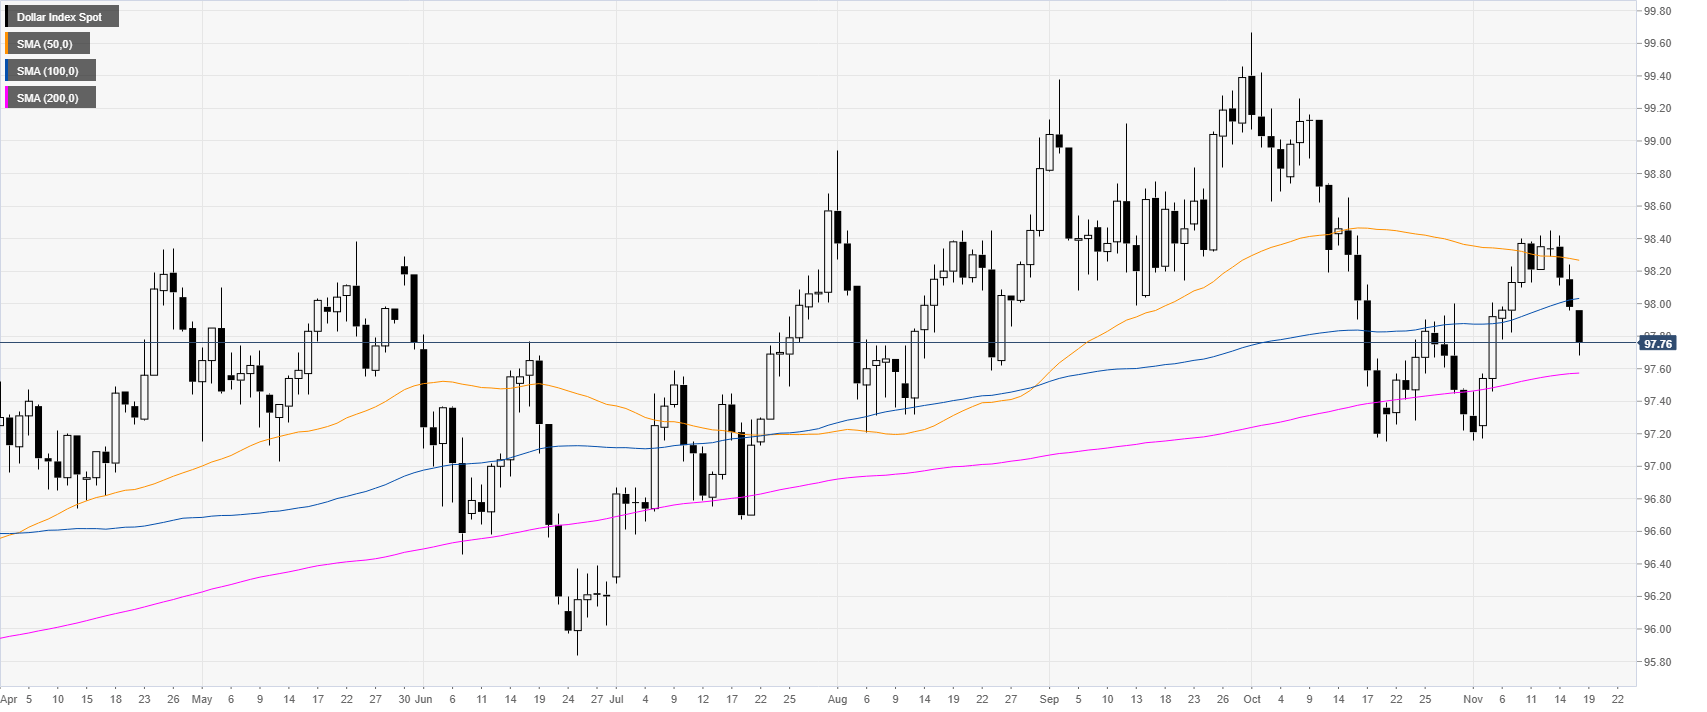
DXY daily chart
DXY (US Dollar Index) is trading in a bull trend above the 200-day simple moving average (DMA). This Monday the buck dropped to its lowest in height-days below the 50 and 100 DMAs.
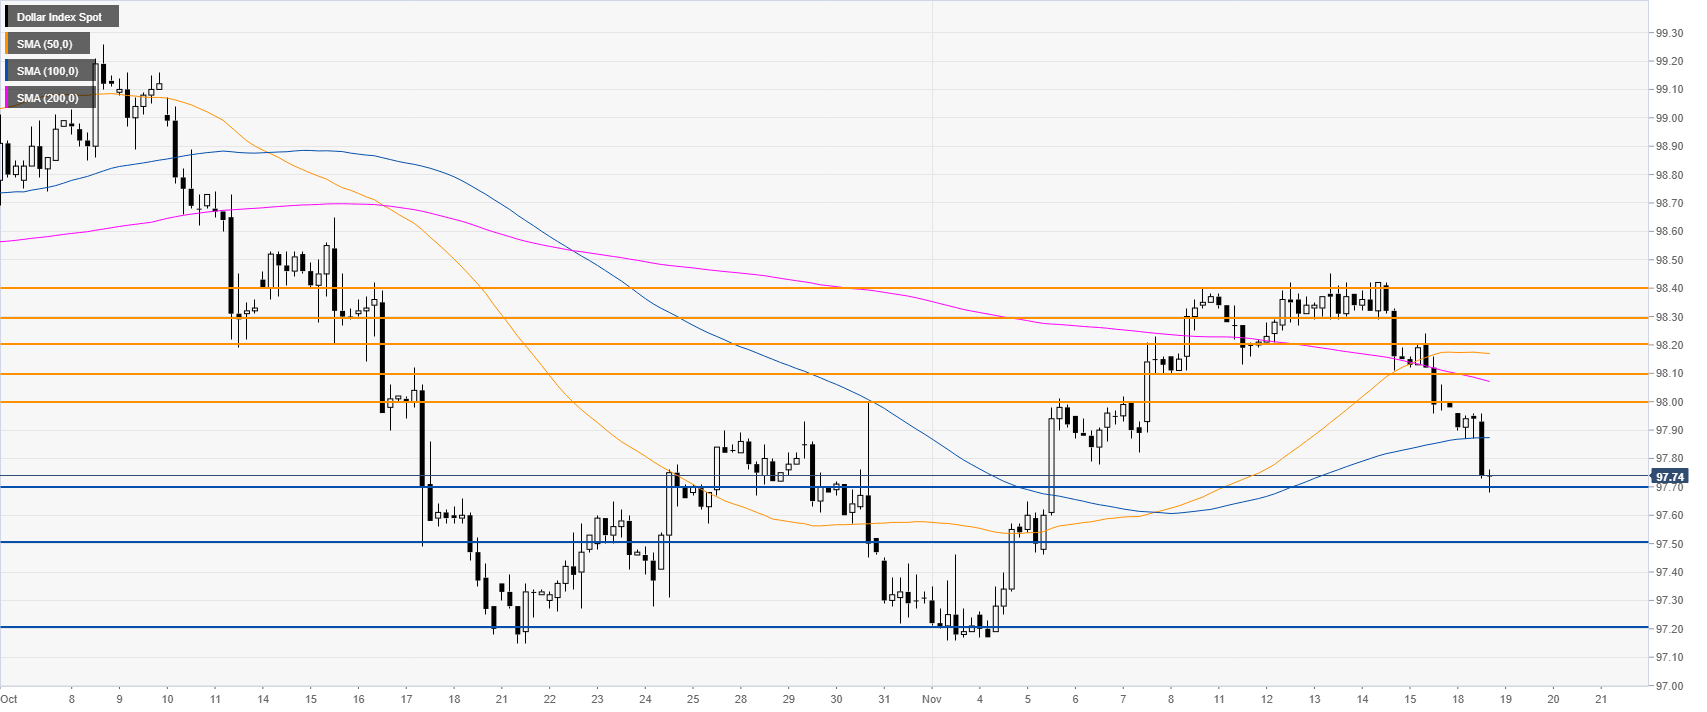
DXY 4-hour chart
DXY is retracing down below the main SMAs, suggesting a bearish bias in the medium term. The market broke below the 98.00 handle The market is now parked just above the 97.70 level. If the bears launch a new attack, the market can decline towards the 97.50 and 97.20 levels
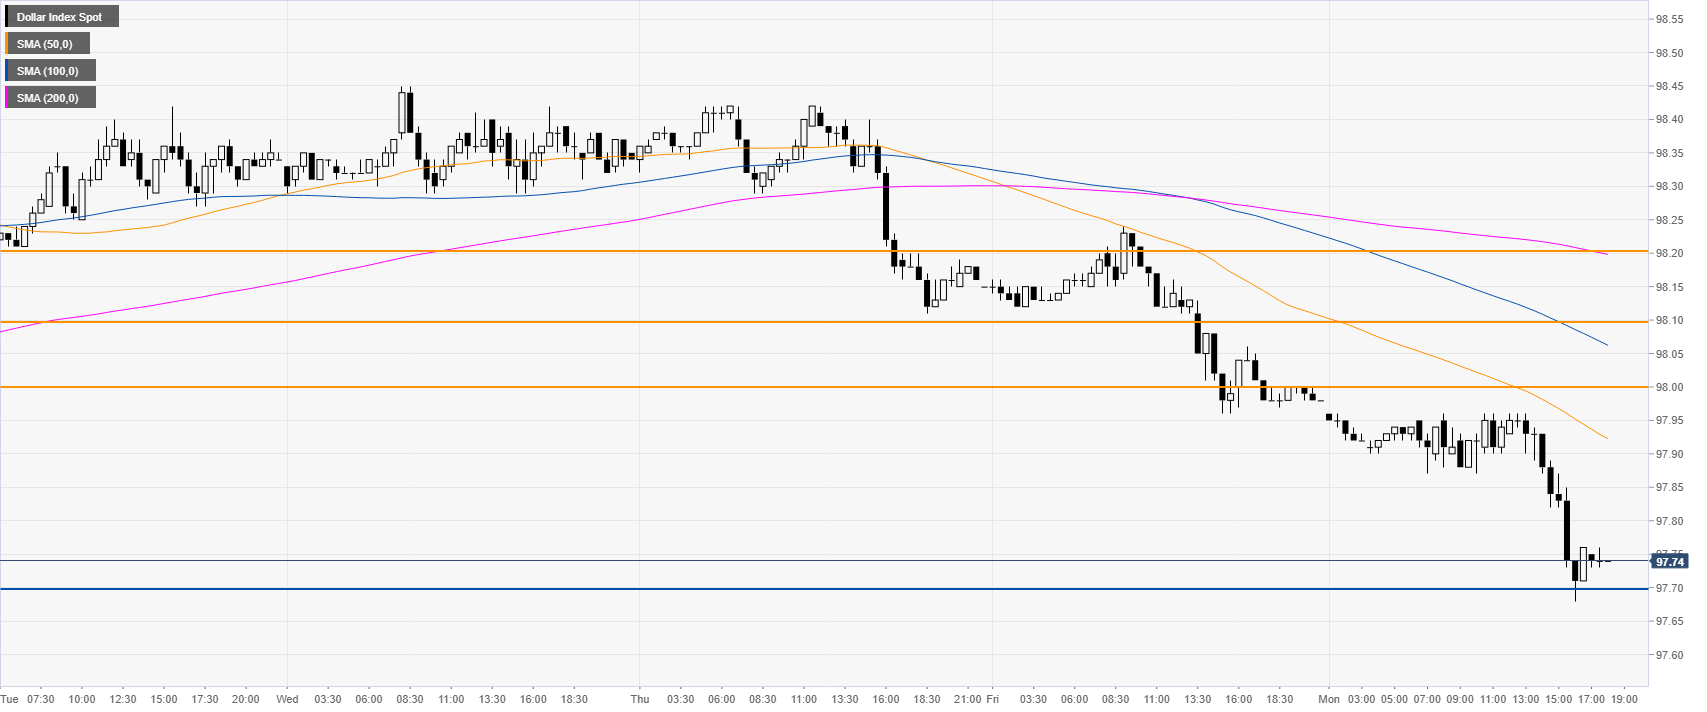
DXY 30-minute chart
The greenback is trading below the main SMAs, suggesting bearish momentum in the medium term. Resistance is seen at the 98.00 handle followed by the 98.10 and 98.20 levels.
Additional key levels
