- DXY is trading in a very tight range in Thursday’s New York session.
- The level to beat for bulls is the 98.40 resistance level.
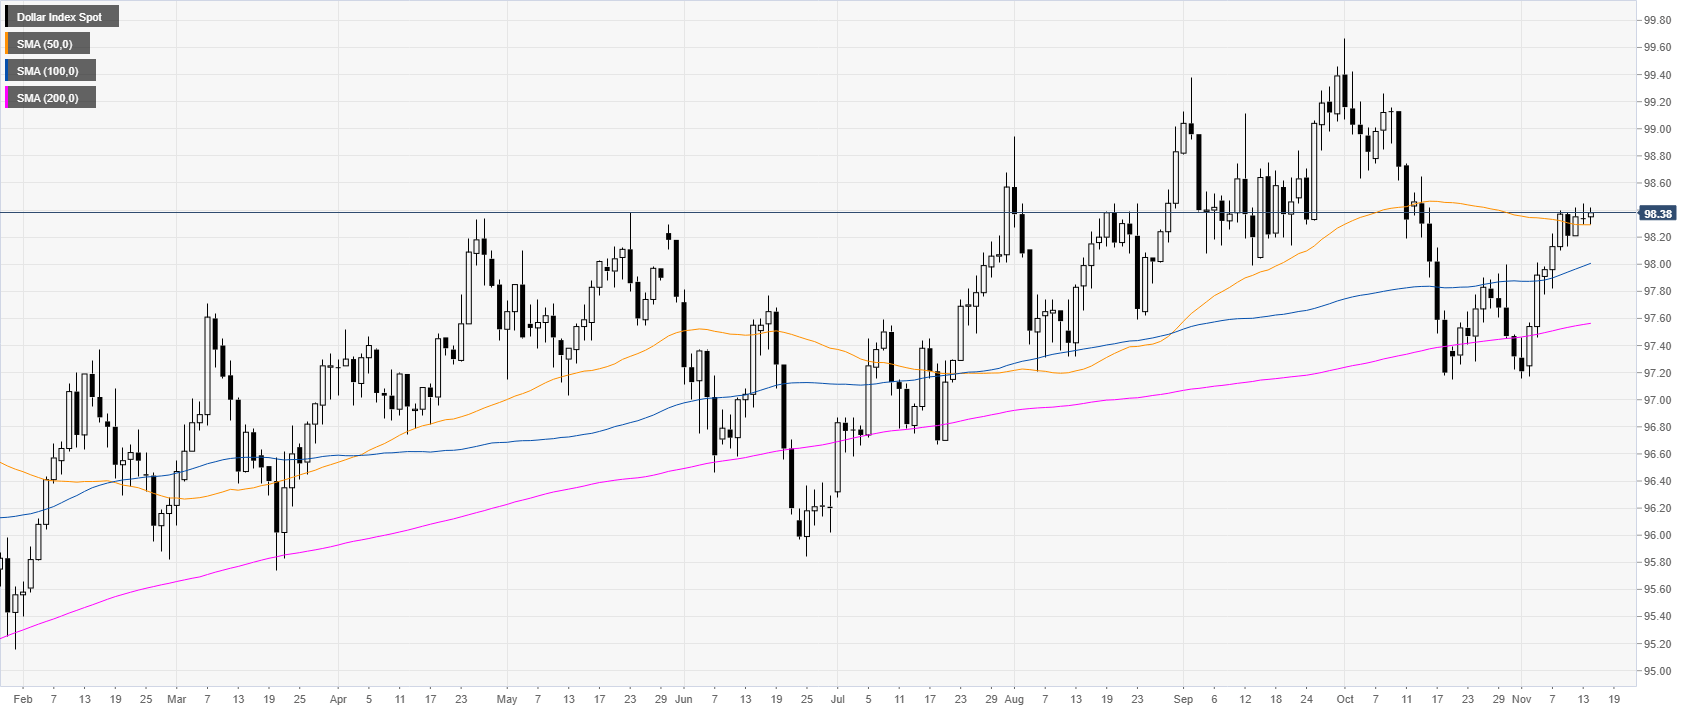
DXY daily chart
DXY (US Dollar Index) is trading in a bull trend above the main daily simple moving averages (DMAs). This Thursday the Greenback is once again challenging the 98.40 level while trading just above the 50 DMA.
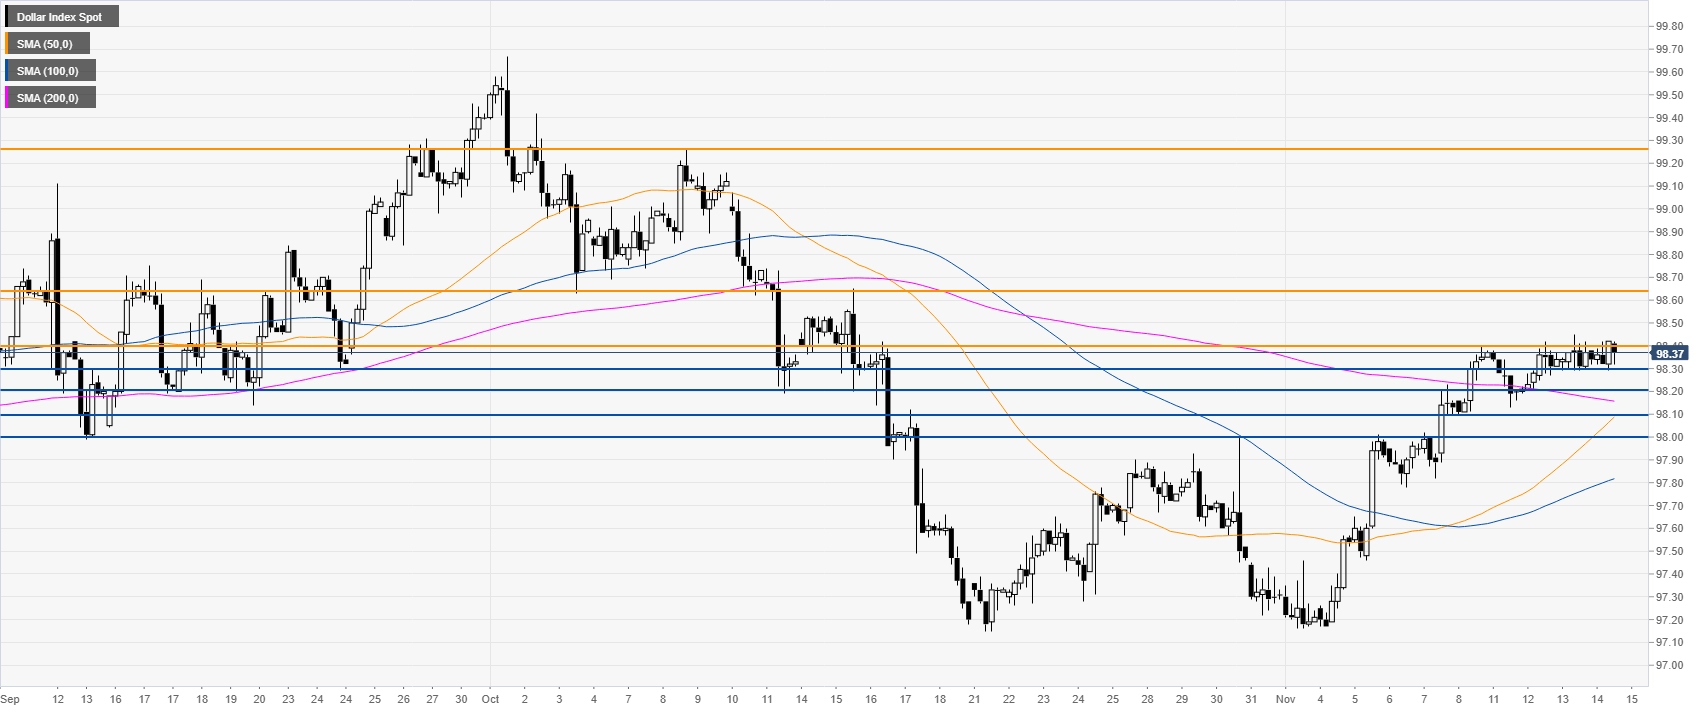
DXY 4-hour chart
DXY keeps pressuring the 98.40 resistance. If the sellers give up and the market breaks above the 98.40 resistance on a daily basis, there is scope for further upside towards the 98.65 and the 99.26 resistances.
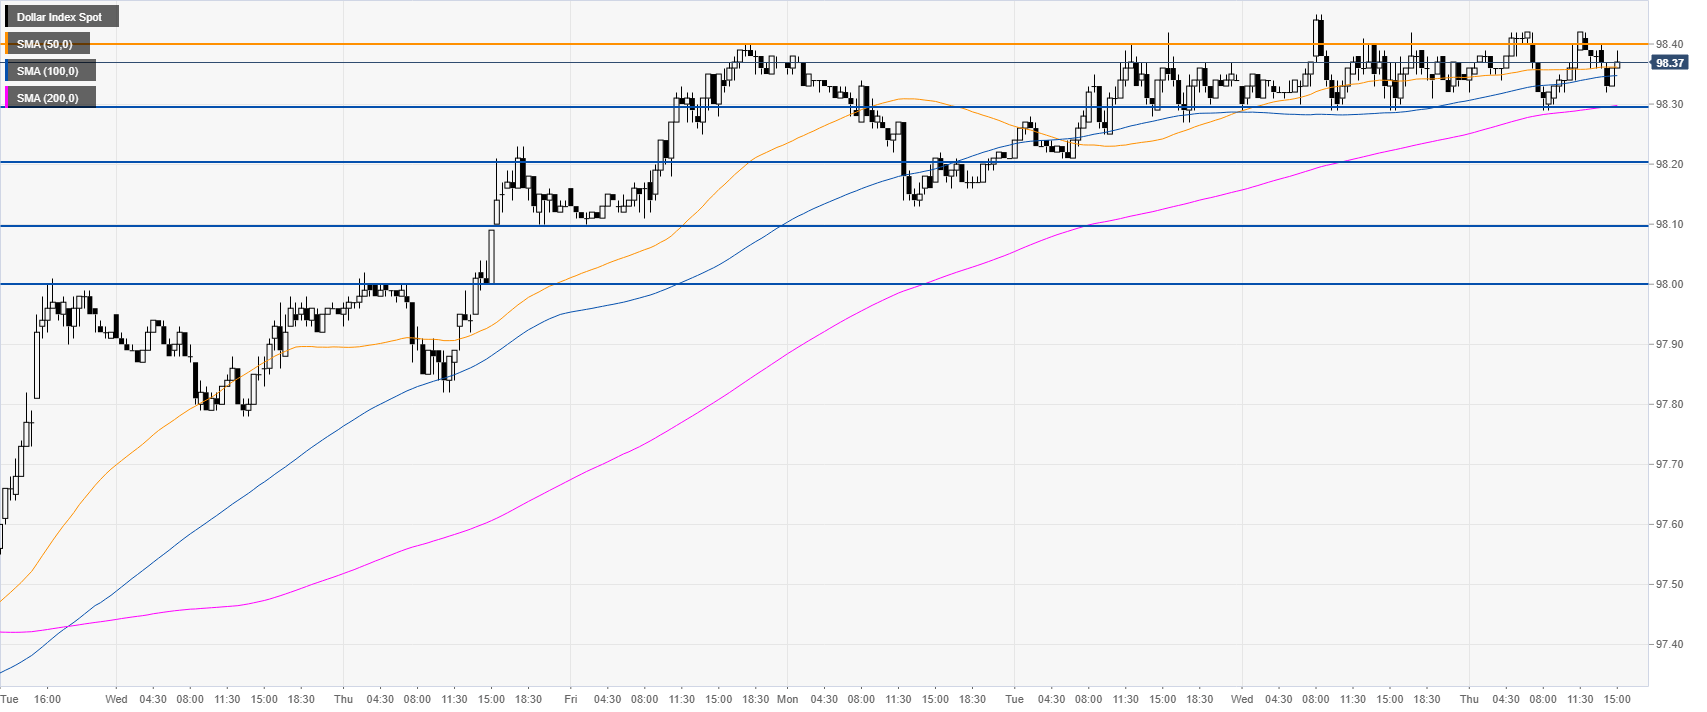
DXY 30-minute chart
DXY is trading above its main SMAs, suggesting a bullish bias in the short term. Support is seen at the 98.30, 98.20 and 98.10 levels.
Additional key levels
