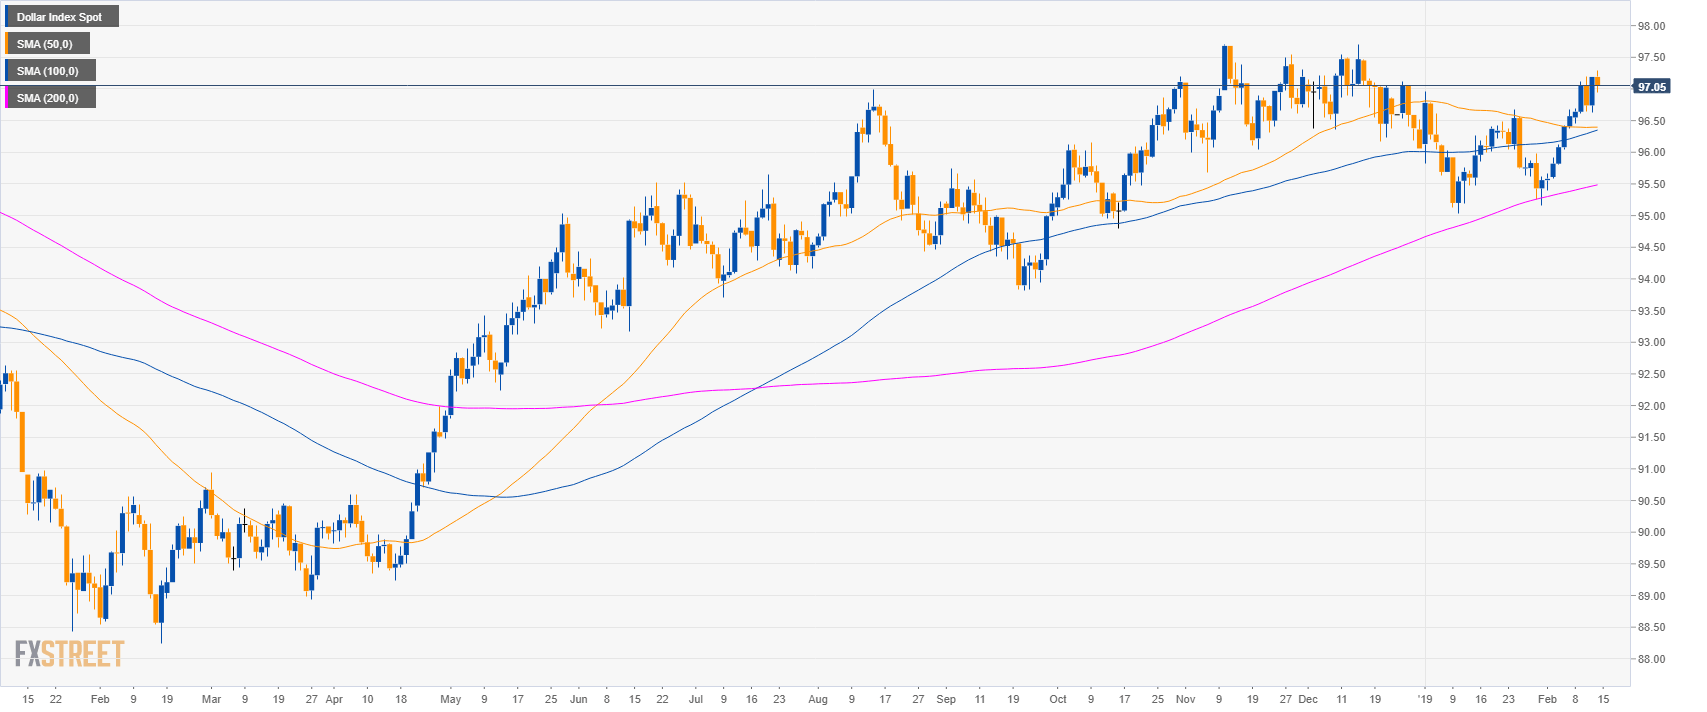
DXY daily chart
- The US Dollar Index (DXY) is trading in a bull trend above its main simple moving averages (SMAs).
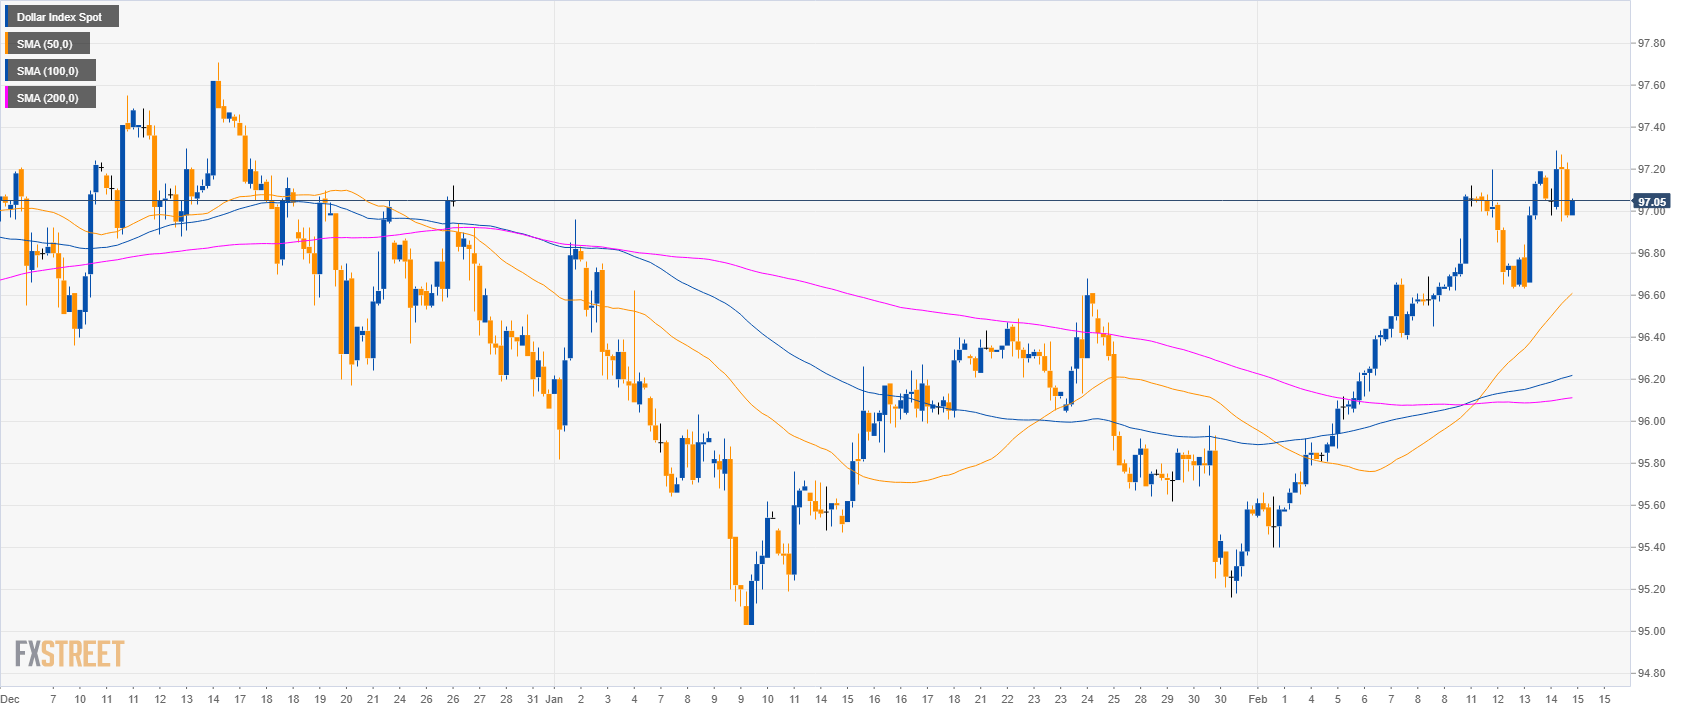
DXY 4-hour chart
- DXY is trading above its main SMAs suggesting bullish momentum in the medium-term.
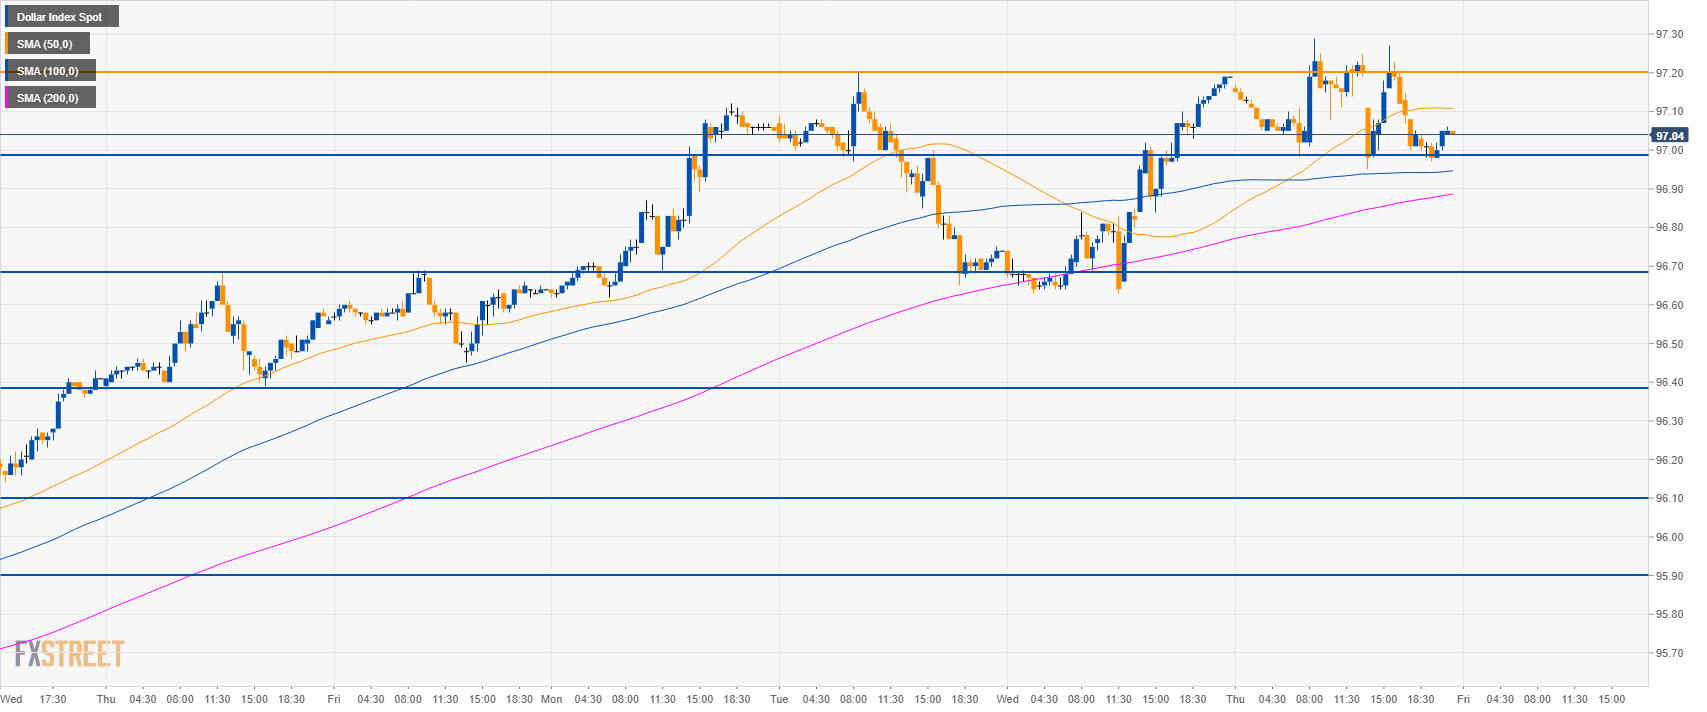
DXY 30-minute chart
- DXY is trading between the 50 and 200 SMAs suggesting a sideways market in the short-term.
- Bears will be trying to break below 97.00 to reach 96.70 to the downside.
- On the flip side, resistances are seen at 97.20 and 98.00 level.
Additional key levels
Dollar Index Spot
Overview:
Today Last Price: 97.05
Today Daily change: -14 ticks
Today Daily change %: -0.14%
Today Daily Open: 97.19
Trends:
Daily SMA20: 96.21
Daily SMA50: 96.4
Daily SMA100: 96.32
Daily SMA200: 95.47
Levels:
Previous Daily High: 97.19
Previous Daily Low: 96.63
Previous Weekly High: 96.69
Previous Weekly Low: 95.58
Previous Monthly High: 96.96
Previous Monthly Low: 95.03
Daily Fibonacci 38.2%: 96.98
Daily Fibonacci 61.8%: 96.84
Daily Pivot Point S1: 96.82
Daily Pivot Point S2: 96.44
Daily Pivot Point S3: 96.26
Daily Pivot Point R1: 97.38
Daily Pivot Point R2: 97.56
Daily Pivot Point R3: 97.94
