- DXY keeps bleeding into Friday as the risk-on mood is hurting the Greenback.
- Next week the market will likely try to break below the 98.00 handle.
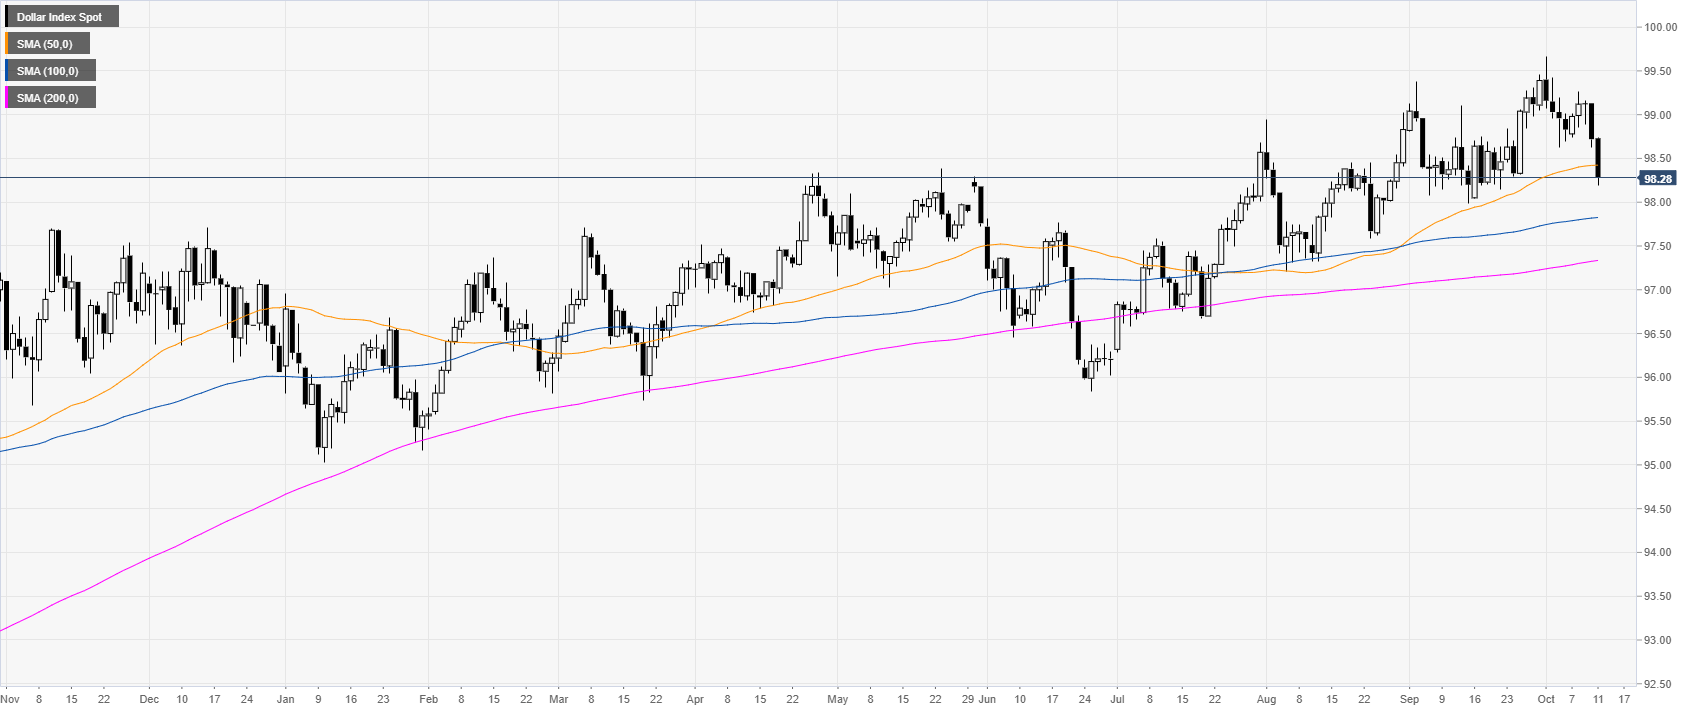
DXY daily chart
The US Dollar Index (DXY) is in a bull trend above the main 100 and 200-day simple moving averages (DSMAs). However, DXY closes this Friday below the 50 SMA. The last time this happened, it was in July this year.
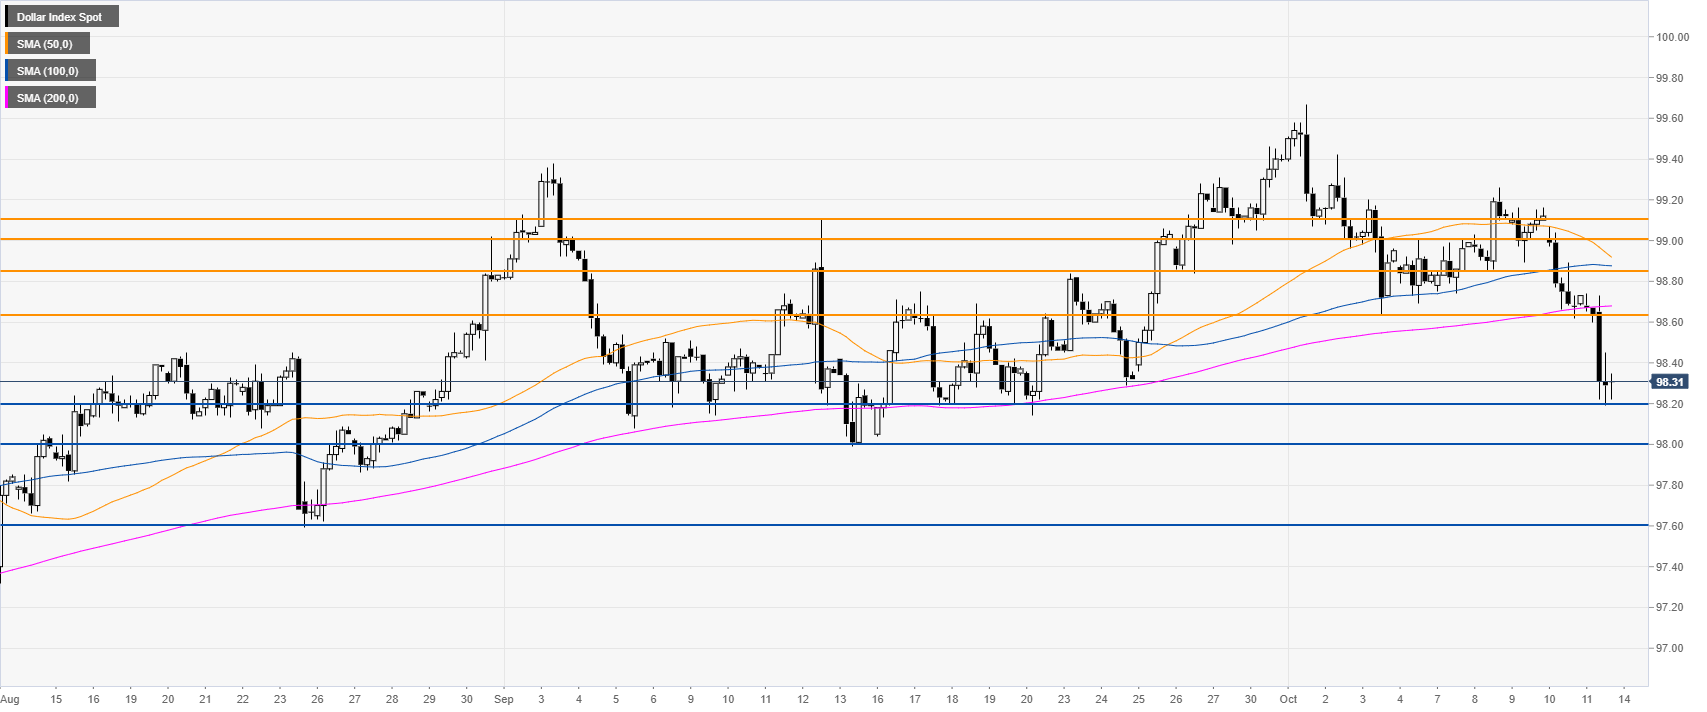
DXY four-hour chart
DXY is trading below its main SMAs, suggesting bearish momentum in the medium term. A break below 98.20 can open the doors to more losses towards the 98.00 handle. A break below this level can lead to 97.60.
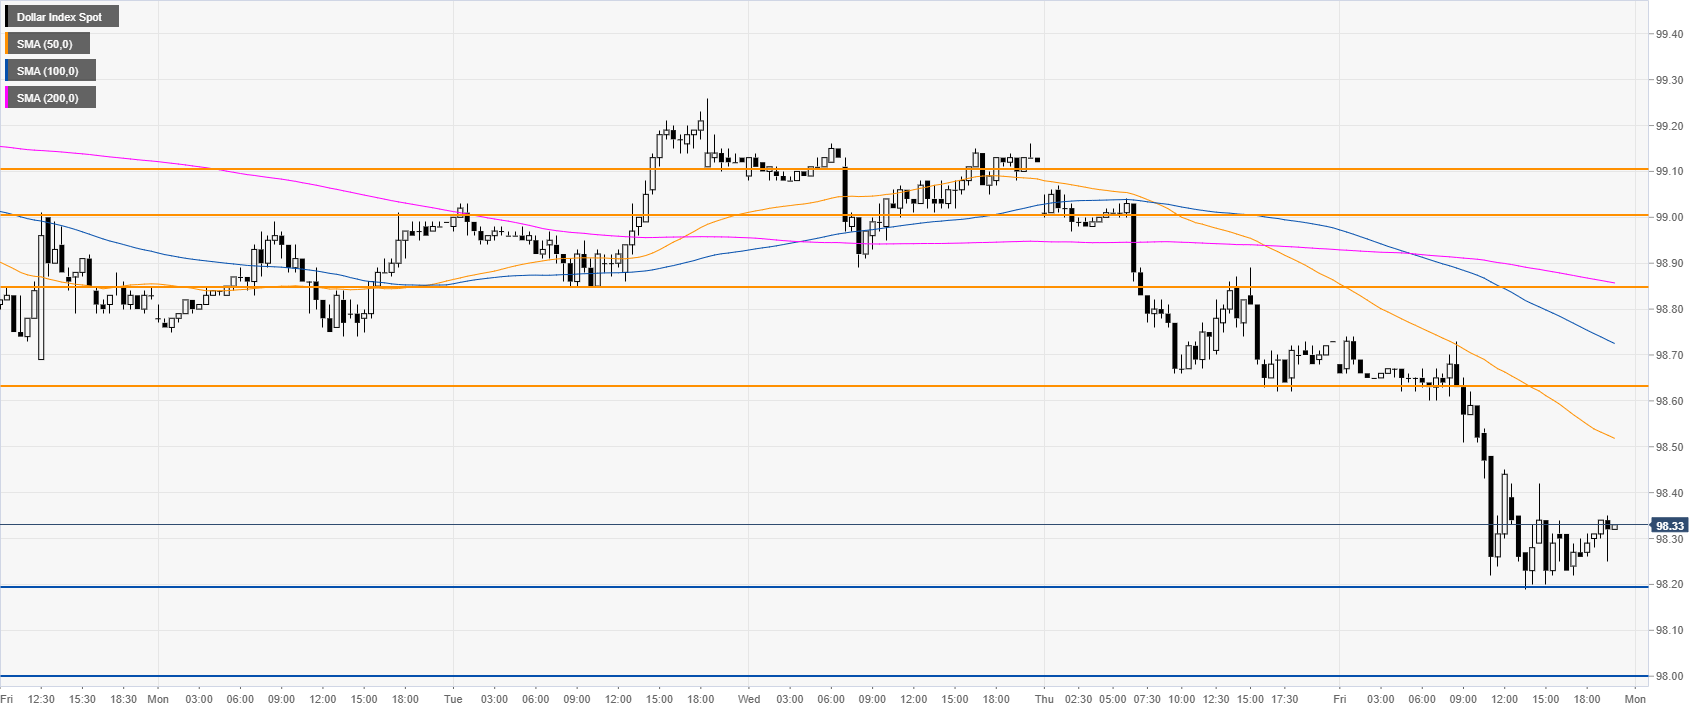
DXY 30-minute chart
DXY is trading below its main SMAs, suggesting a bearish momentum in the near term. Resistances are seen at the 98.63 and 98.85 price levels.
Additional key levels
