- The FOMC Minutes failed to provide any new information.
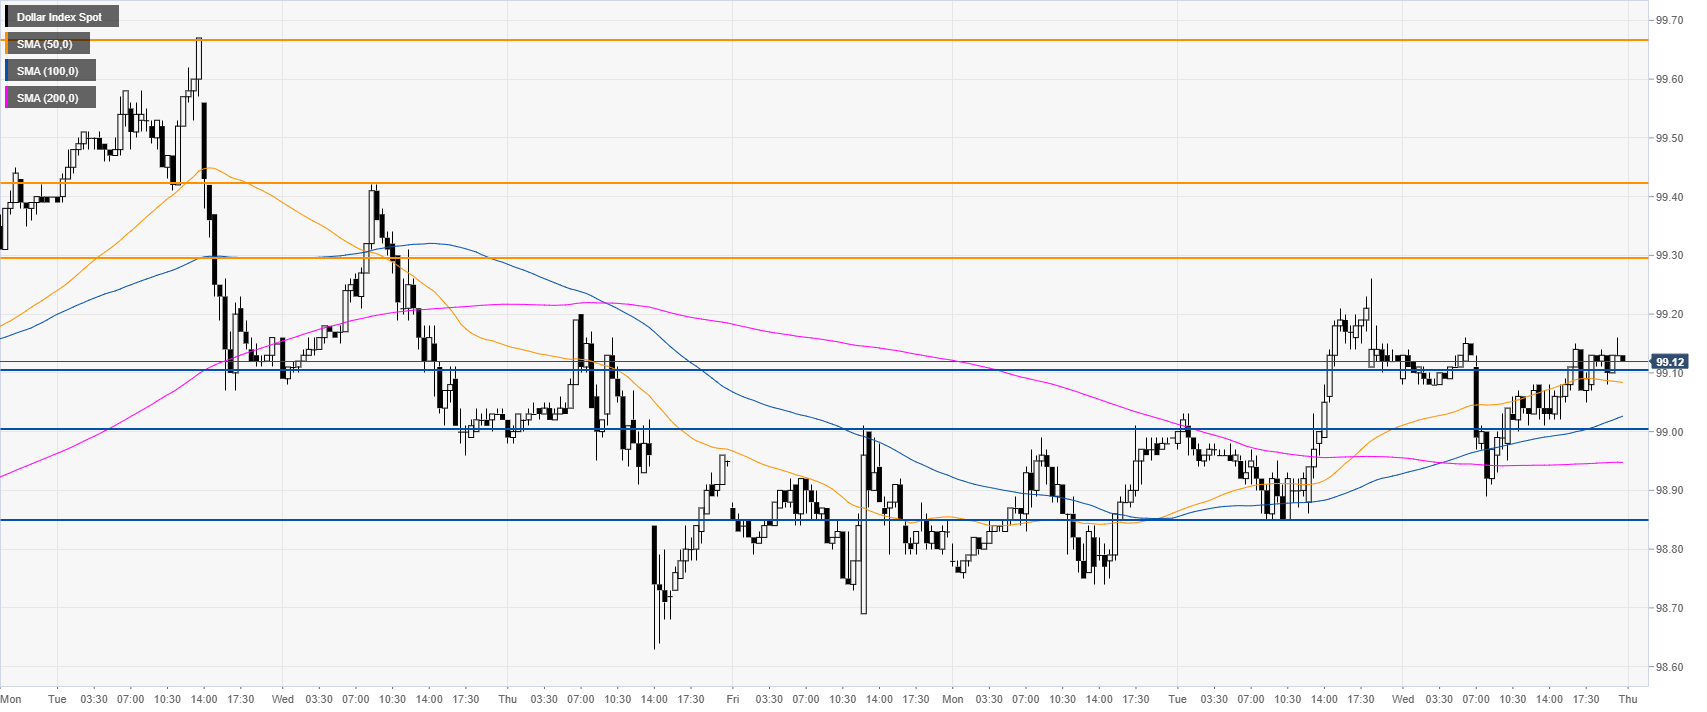
- The 99.30 resistance is the level to beat for bulls.
- Market players will focus on the US inflation data on Thursday.
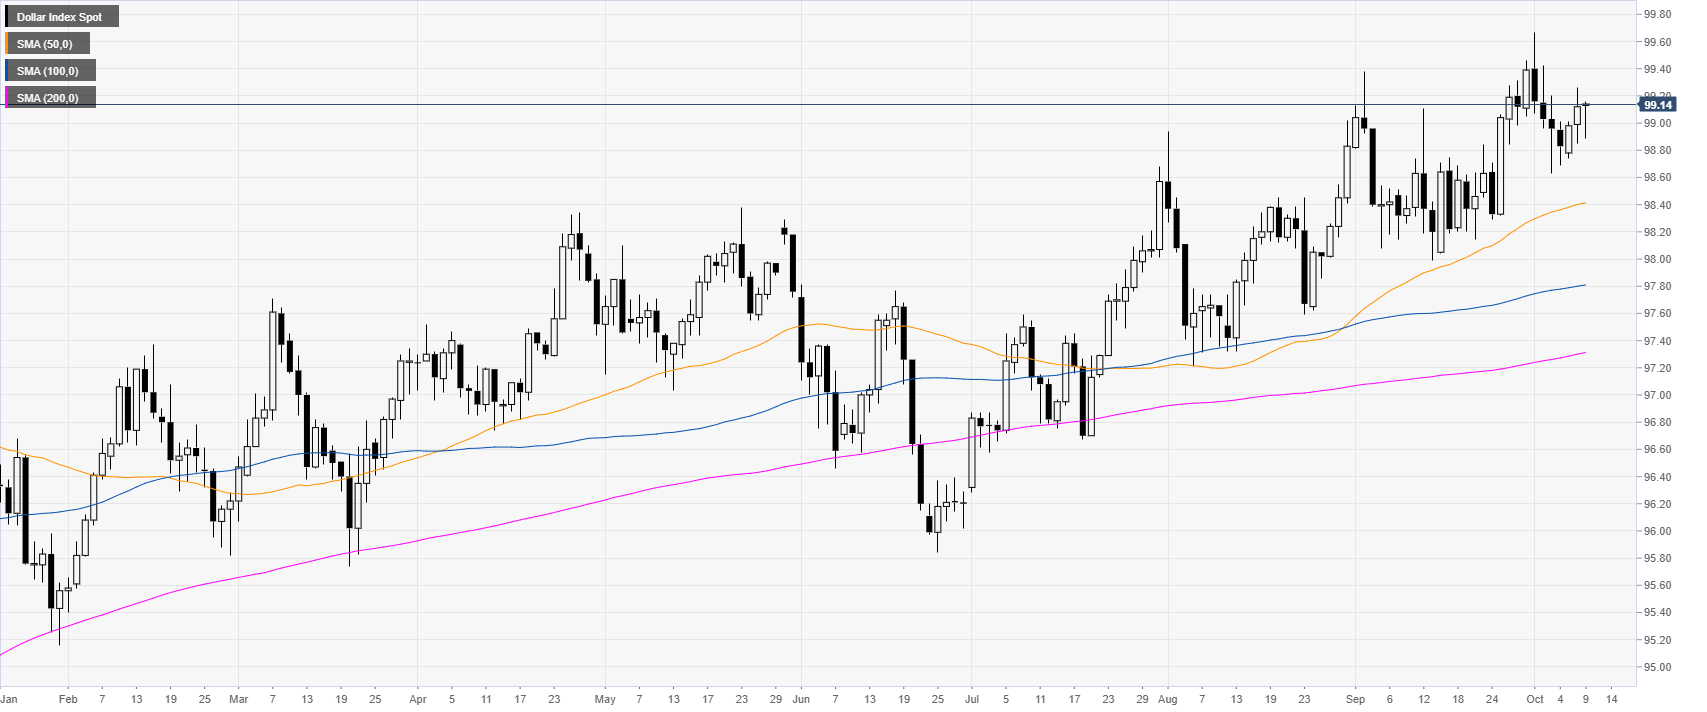
DXY daily chart
The US Dollar Index (DXY) is trading in a bull trend above its main daily simple moving averages (DSMAs). The FOMC bring little to no action as Fed’s Powell reiterates known facts: “risks come from abroad, chances of a recession are limited, the economy overall is healthy.” Investors will focus on the Consumer Price Index (CPI) in the United States this Thursday at 12:30 GMT.
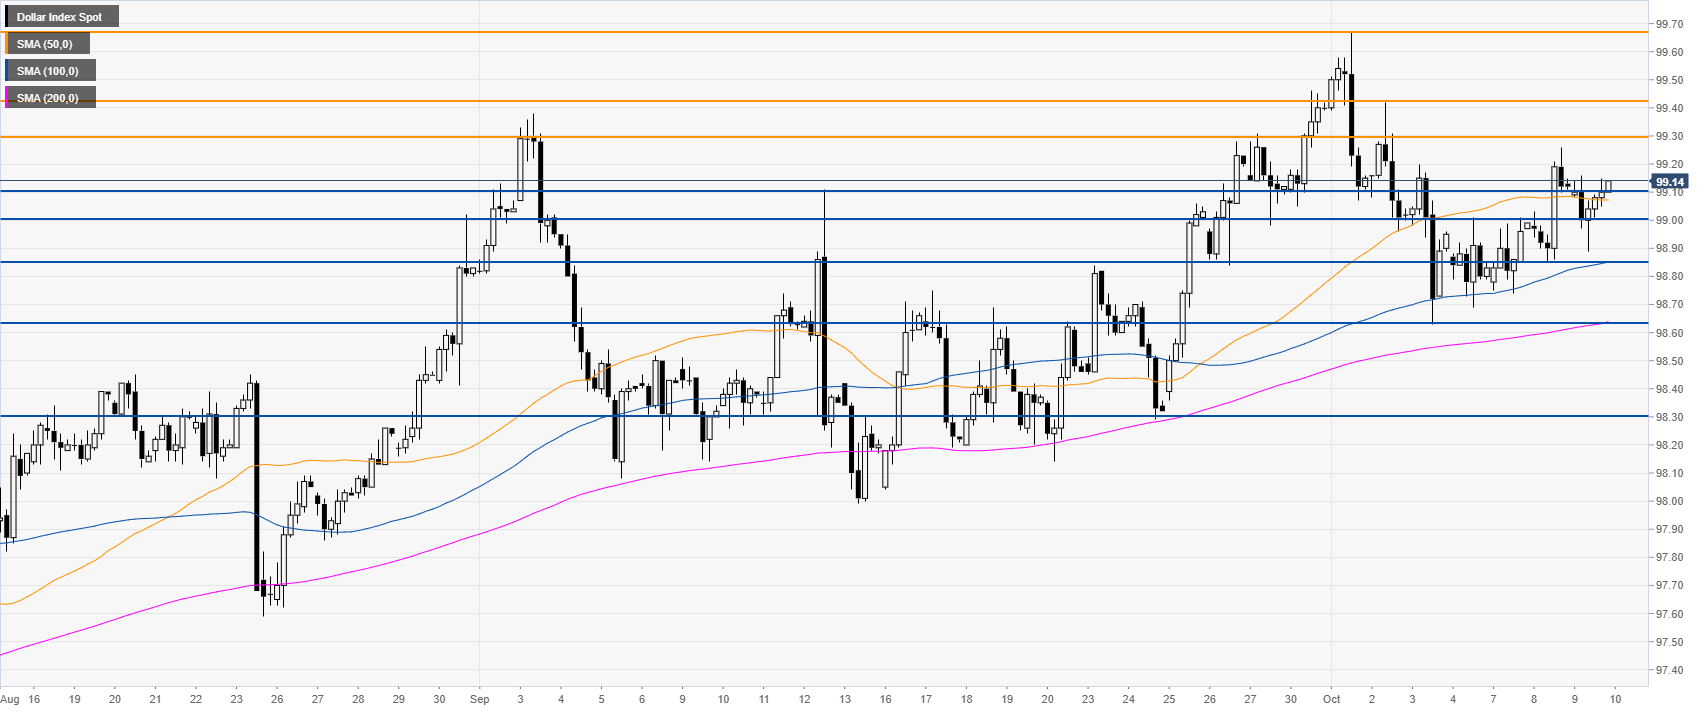
DXY four-hour chart
DXY is trading above the main SMAs, suggesting bullish momentum in the medium term. A daily close above 99.10 could open the gates towards 99.30/99.43 resistance zone.
DXY 30-minute chart
DXY is trading above the main SMAs, suggesting bullish momentum in the short term. Support is seen at the 99.00/99.10 support zone and the 98.85 price levels.
Additional key levels
