- The Greenback is on the back foot this Friday as the market is hanging near the 2019 highs.
- The market is challenging the 99.10 support level.
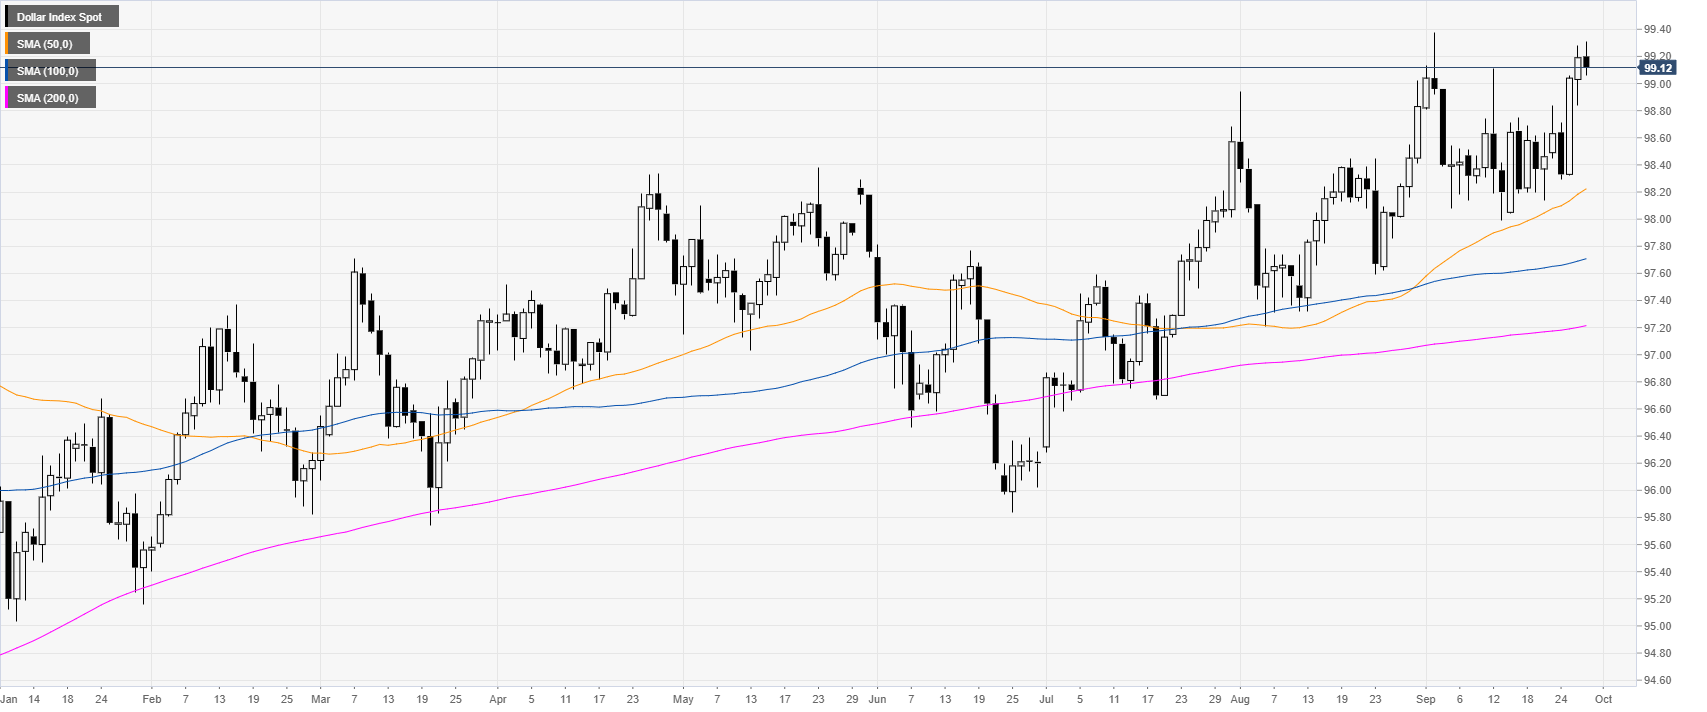
DXY daily chart
DXY (US Dollar Index) is an uptrend above the main daily simple moving averages (DSMAs). The market almost reached the 2019 high at 99.38 before retreating slightly.
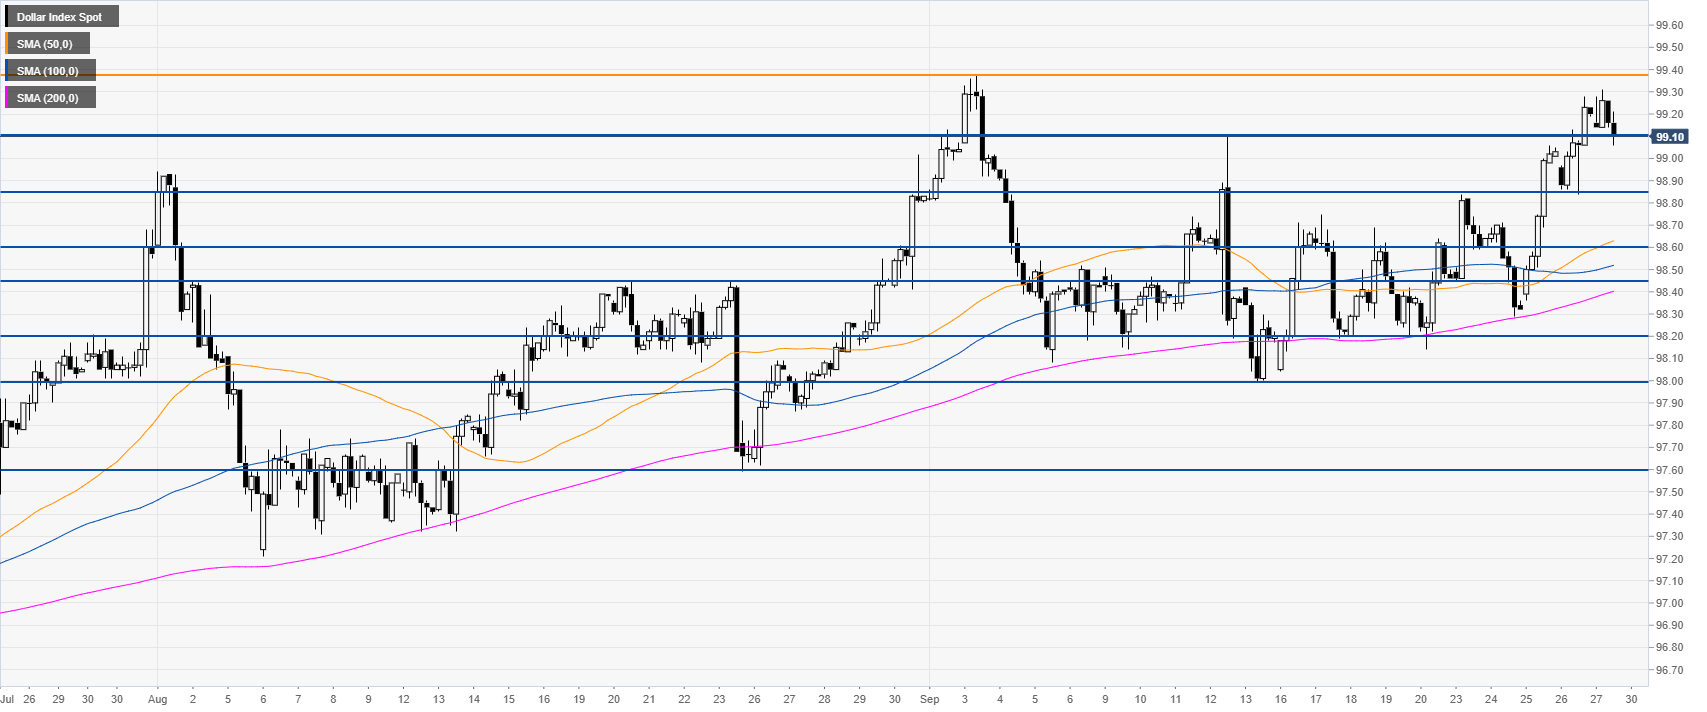
DXY four-hour chart
DXY is retreating before reaching the 2019 high at 99.38. The market is probing the 99.10 support. It will be interesting to see if the market will hold on and get another test of the 2019 high.
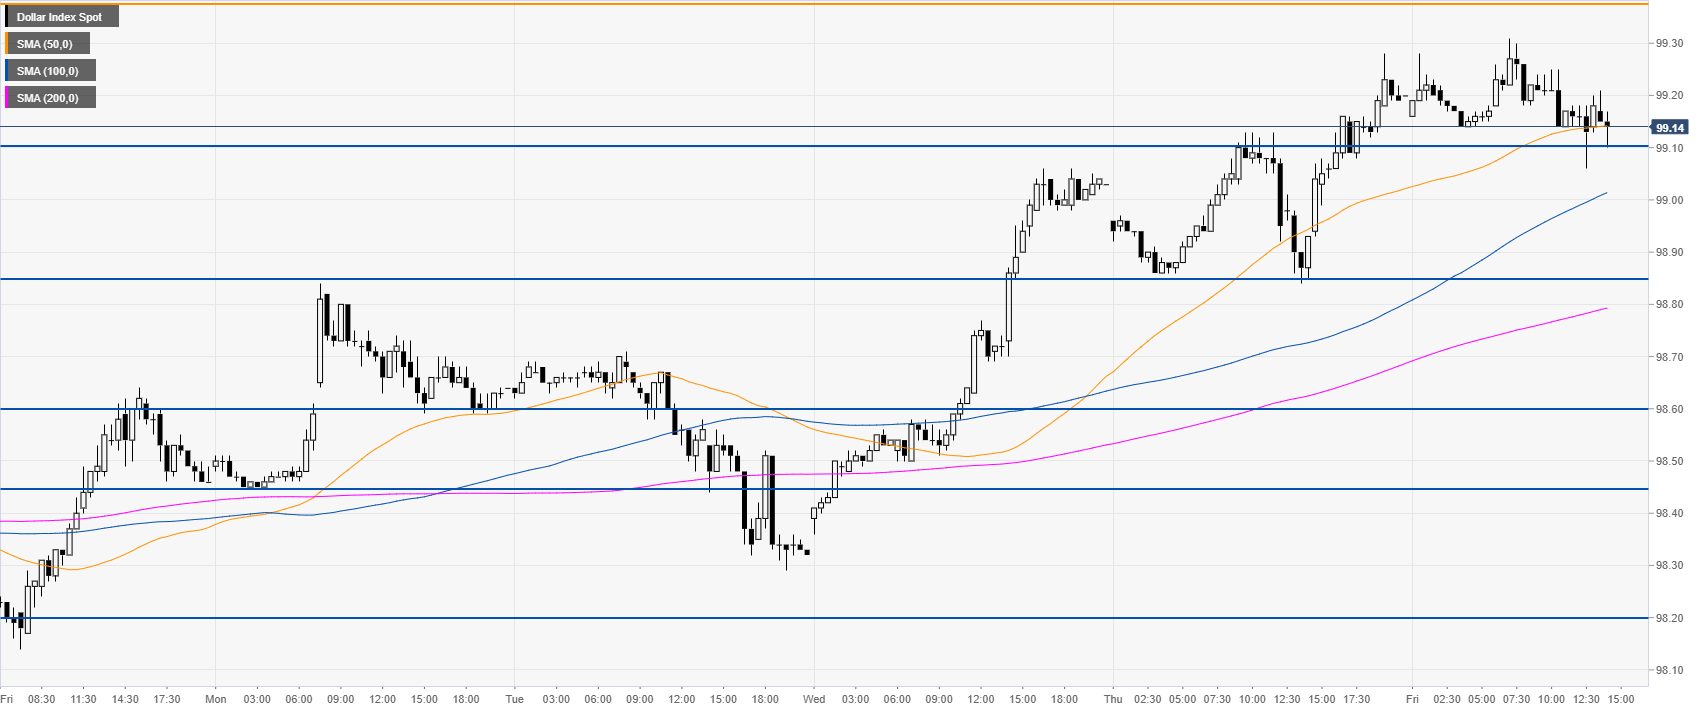
DXY 30-minute chart
DXY is challenging the 99.10 support and the 50 SMA, suggesting a neutral bias in the short term. Immediate support is seen at the 98.85 and 98.60 price level.
Additional key levels
