- DXY is trading mixed this Friday but down for the week.
- The US Non-Farm Payrolls came below forecast at 136K vs. 145K in September, while wages disappointed at 2.9% vs. 3.2% forecast.
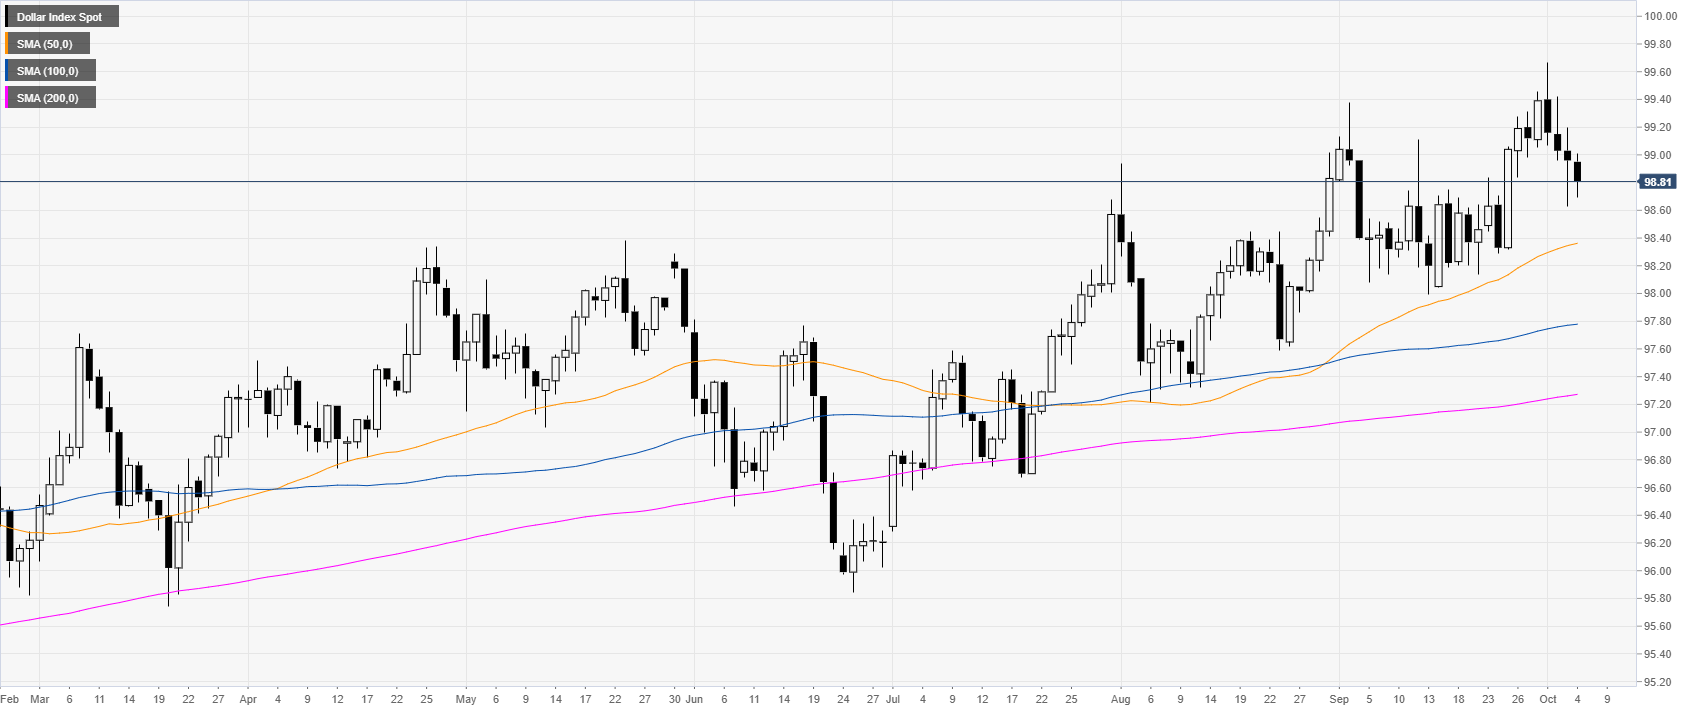
DXY daily chart
The US Dollar Index (DXY) is an uptrend above its main daily simple moving averages (DSMAs). Earlier in the New York session, the US Non-Farm Payrolls came below expectations at 136K vs. 145K in September, while wages also disappointed at 2.9% vs. 3.2% forecast.
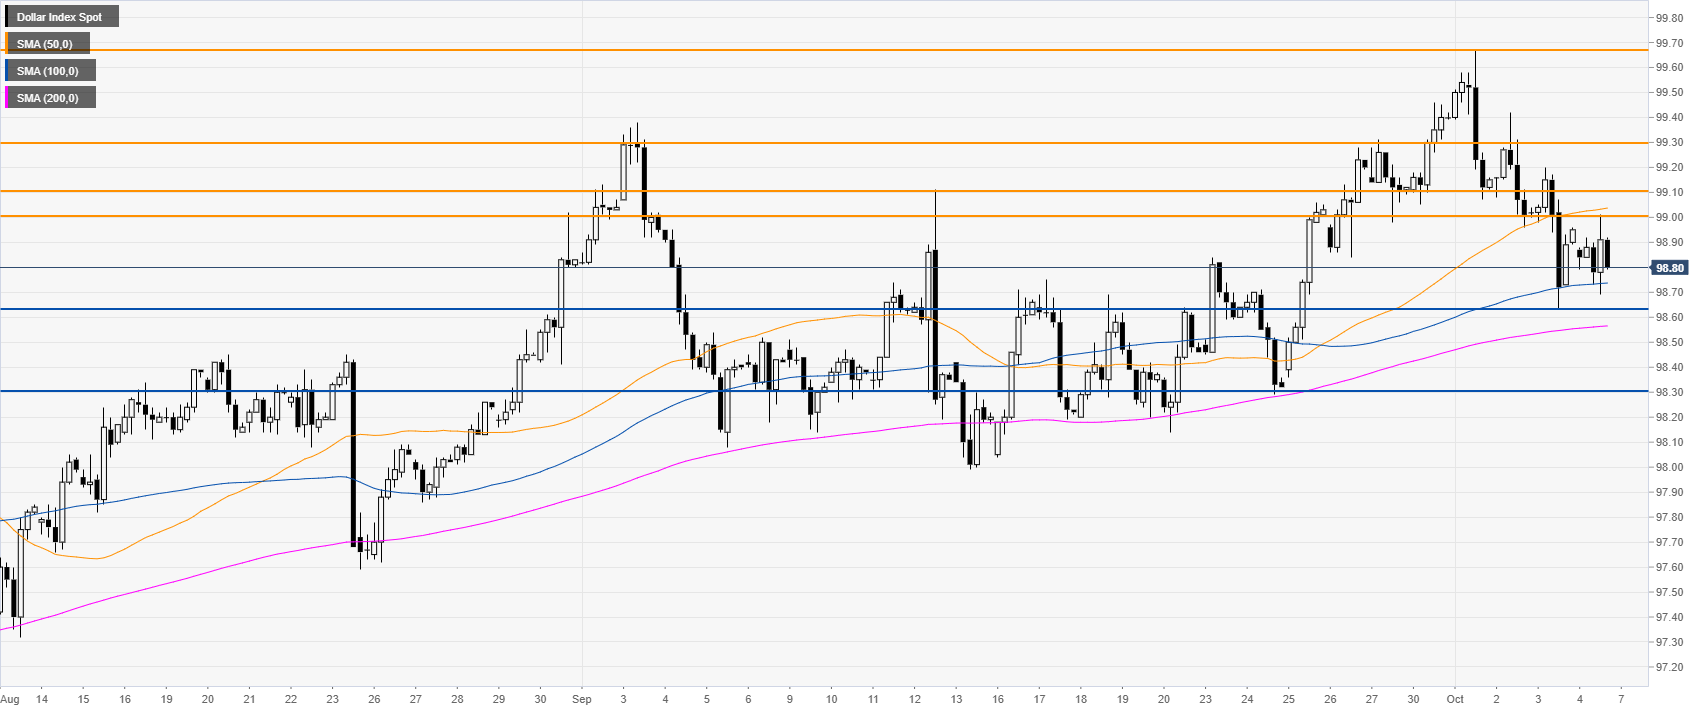
DXY four-hour chart
DXY is trading in the 98.63-99.00 range and between the 50 and 100 SMAs. A break of the 99.00/99.10 resistance zone could lead to 99.30 in the medium term.
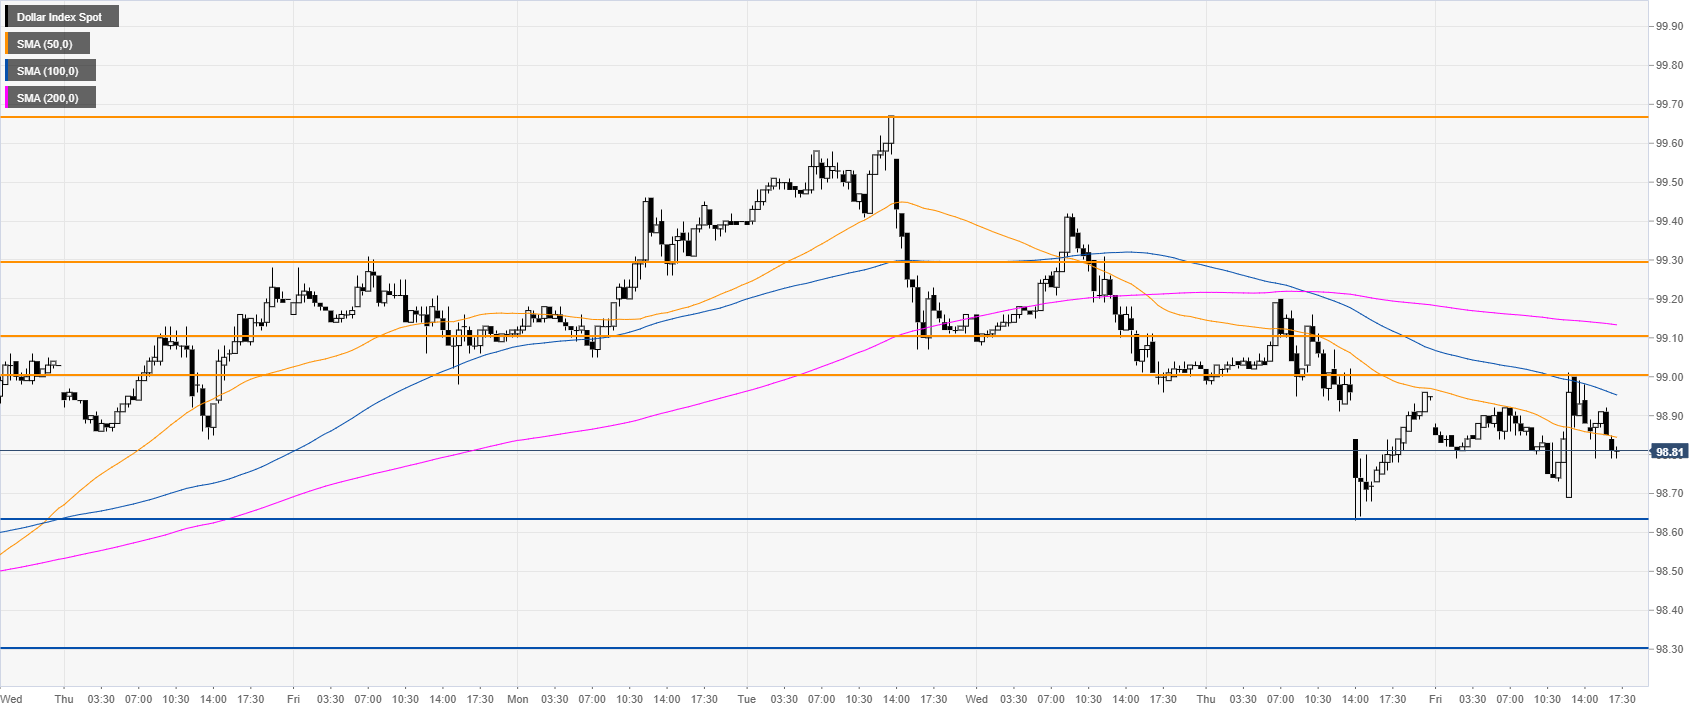
DXY 30-minute chart
DXY is trading below its main SMAs, suggesting a bearish bias in the short term. A break of 98.63 support can expose 98.30 on the way down.
Additional key levels
