- DXY (US Dollar Index) is starting the week on the back foot.
- The level to beat for bulls is at the 98.42 and 98.68 resistance levels.
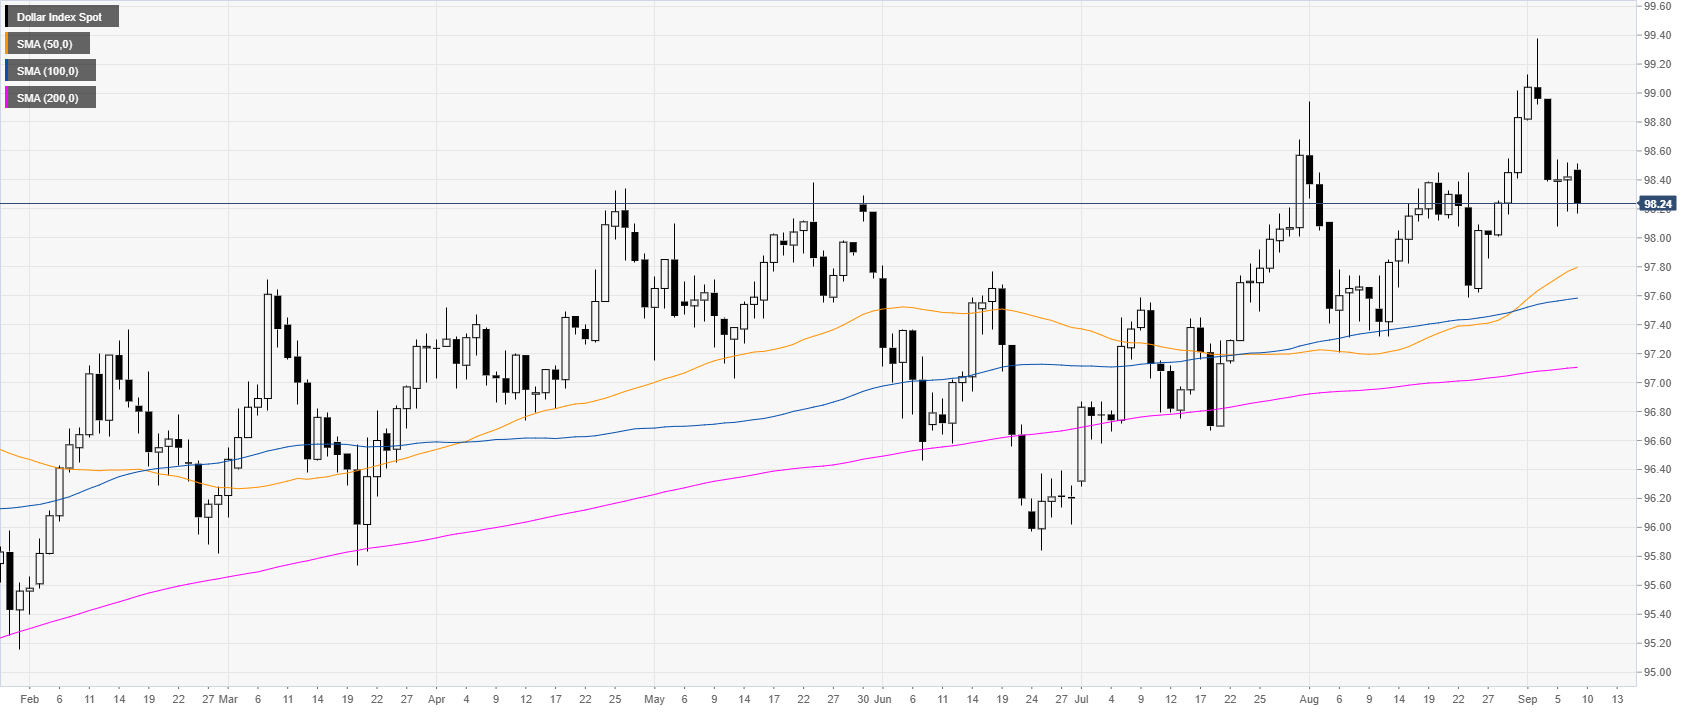
DXY daily chart
DXY (US Dollar Index) is trading in a bull trend above its main daily simple moving averages (DSMAs). DXY is consolidating its recent losses for the third day in a row.
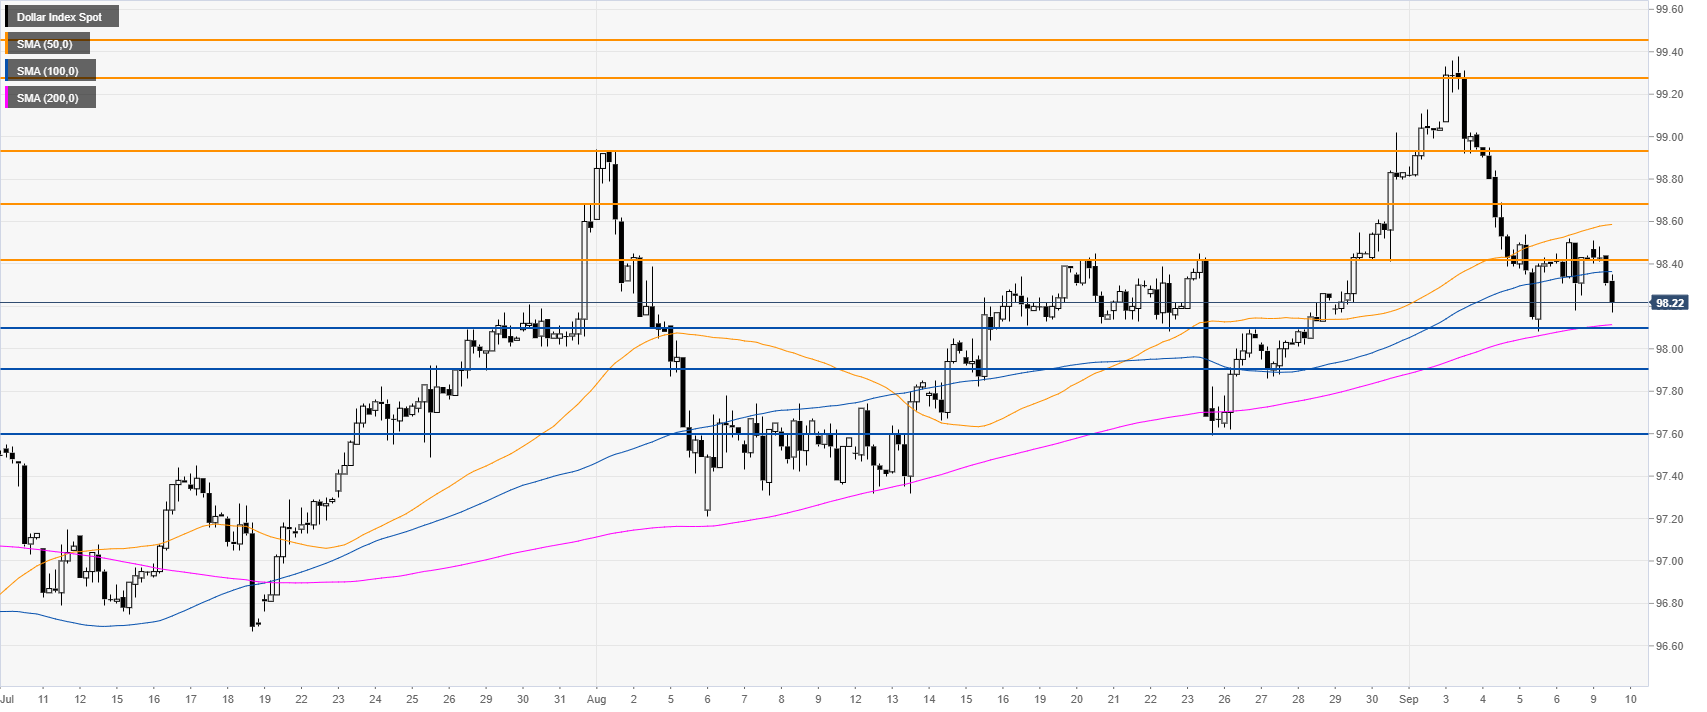
DXY four-hour chart
The Greenback is trading above the 98.10 support and the 200 SMAs. DXY bulls need to overcome the 92.42 resistance to regain the 98.68 price level in the medium term.
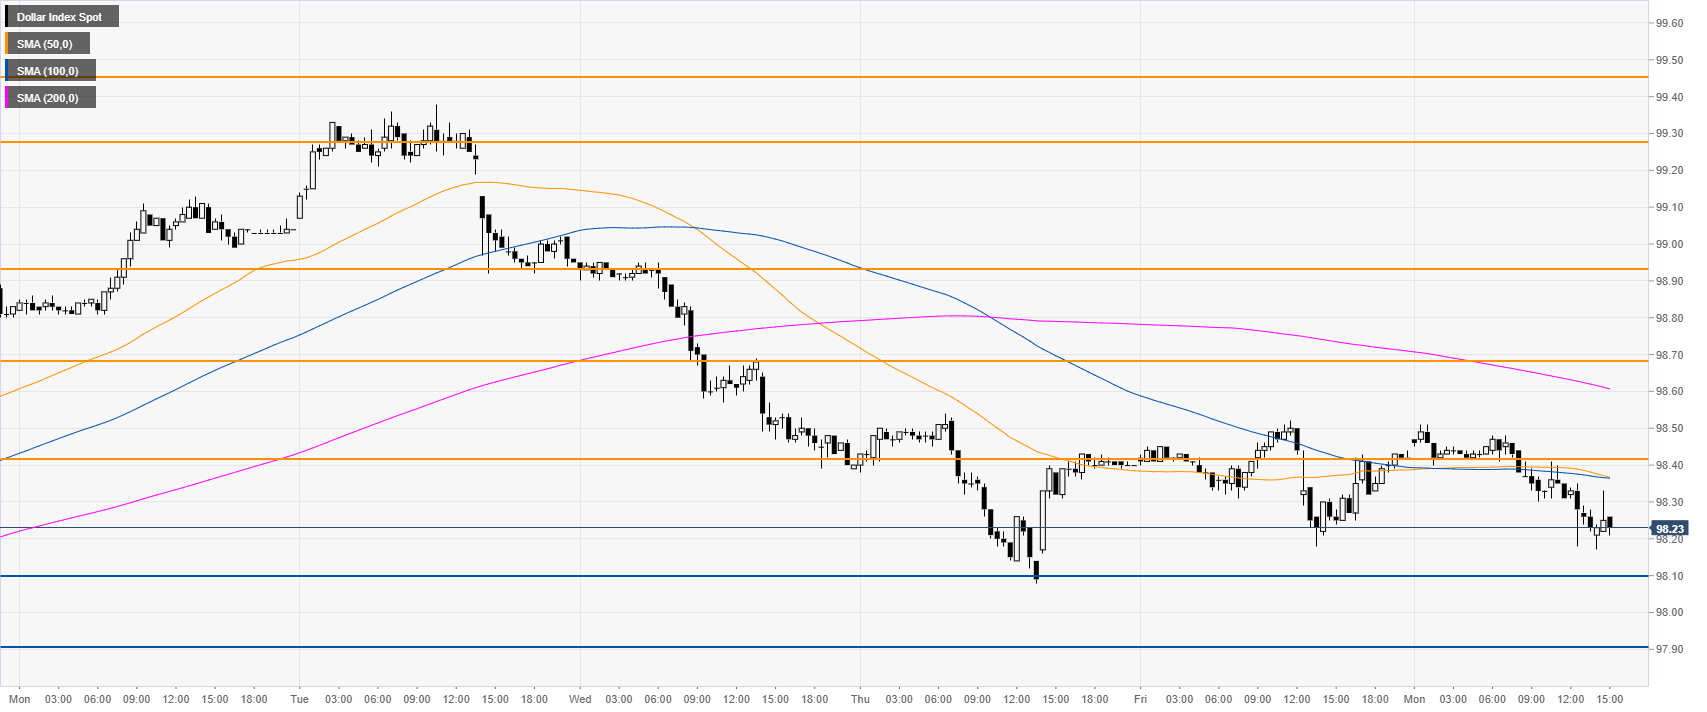
DXY 30-minute chart
DXY is trading below the main SMAs, suggesting bearish momentum in the near term. If the market breaks below 98.10 support, then the 97.90 level could come into play.
Additional key levels
