- The US Dollar Index (DXY) broke below 97.30 support.
- The market is turning bearish and could potentially decline towards 97.00 and 96.74.
The Greenback sold off as the latest FOMC report is hinting at cutting interest rates. This was perceived as dovish by the market and bearish for the American currency.
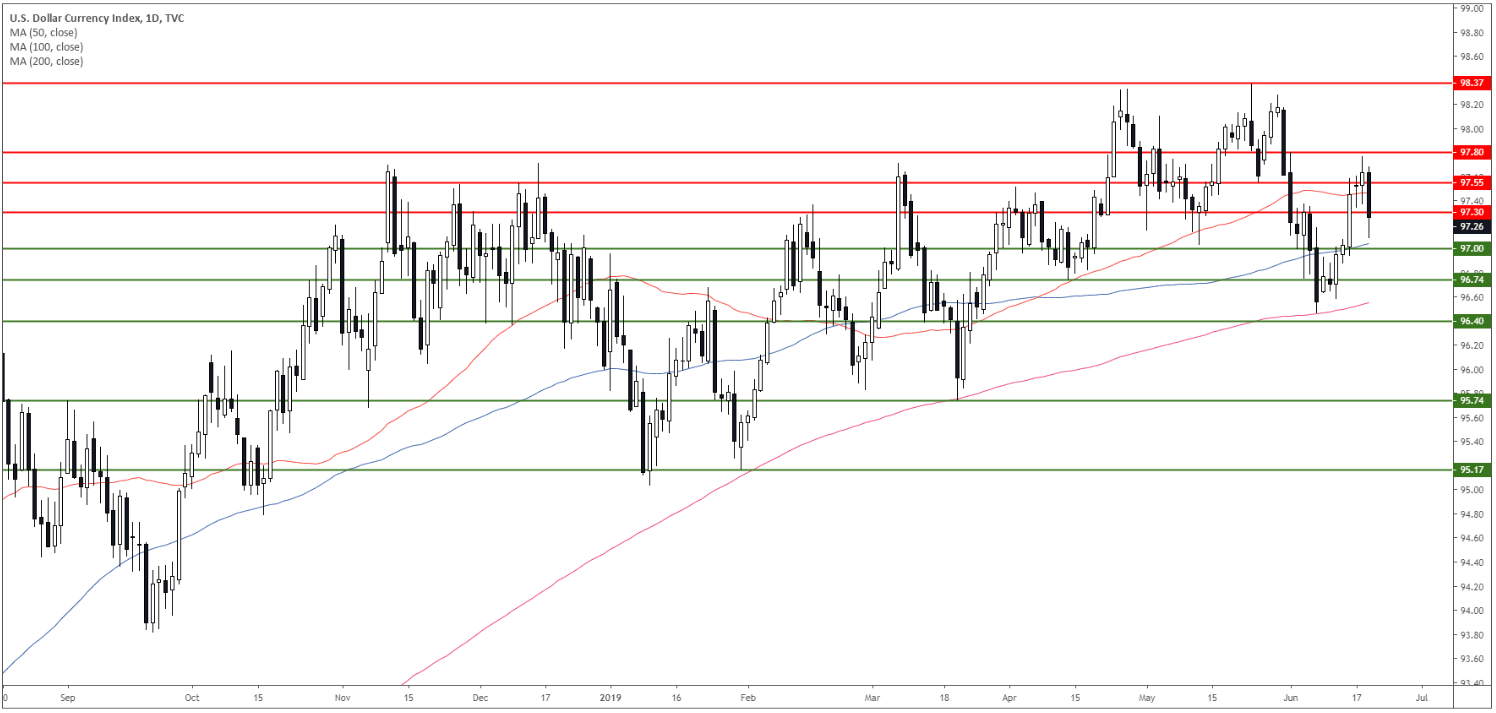
DXY daily chart
The US Dollar Index (DXY) is in a bull trend above its 100 and 200-day simple moving averages (DSMA). The market retraced unable to break above 97.80 resistance.

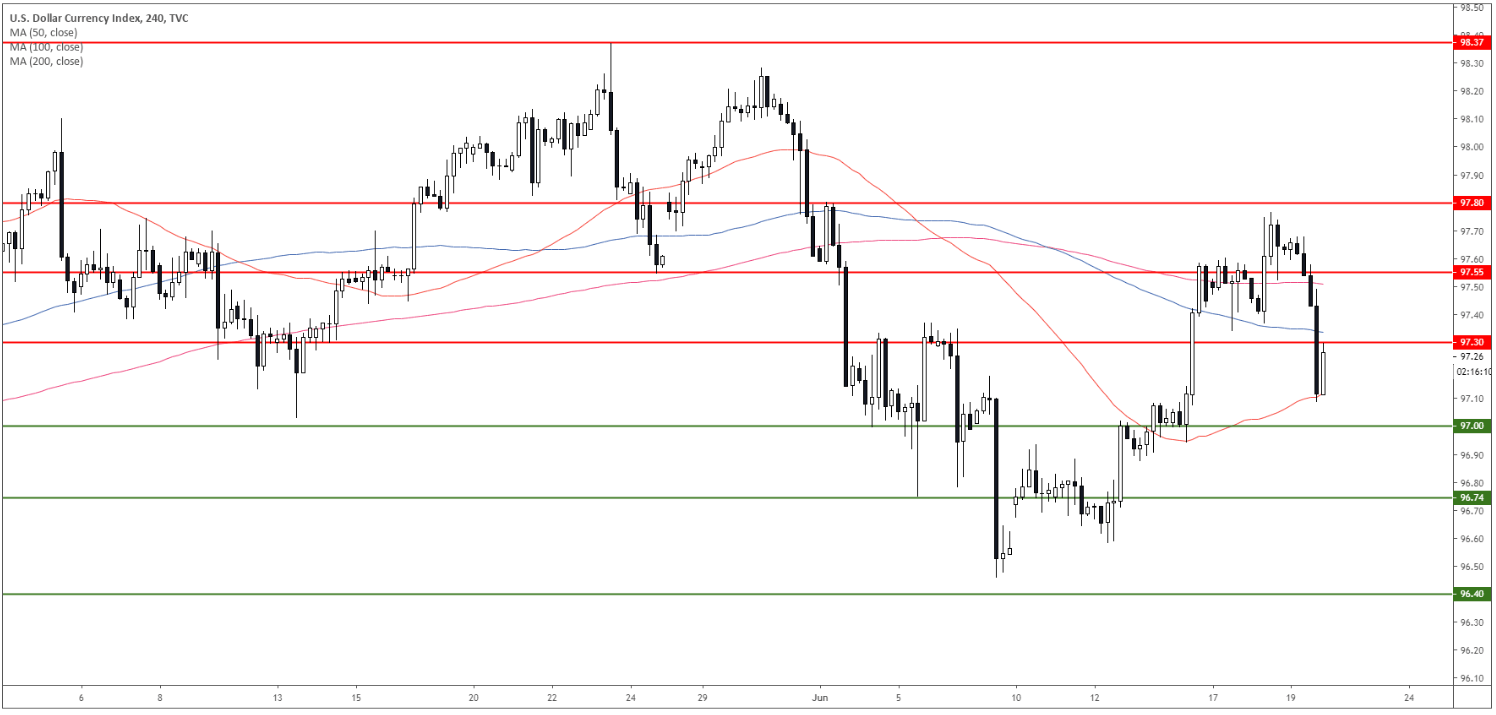
DXY 4-hour chart
DXY broke below the 97.30 level and its 50 and 100 SMAs. It found some support at the 50 SMA just above 97.00.
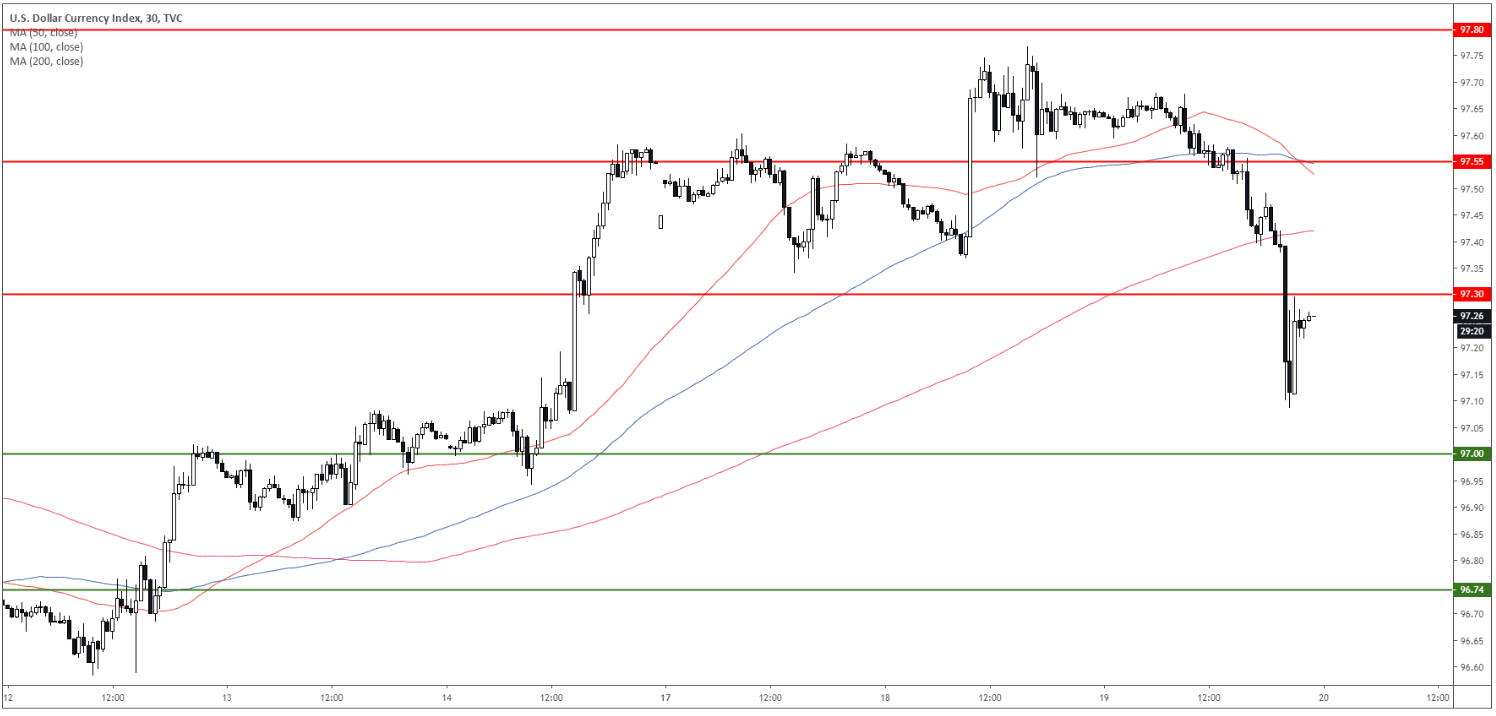
DXY 30-minute chart
DXY is trading below 97.30 and its main SMAs suggesting bearish momentum in the near term. The 50 SMA is crossing below the 100 SMA which is a bearish sign. The market can potentially decline towards 97.00 and 96.74. Immediate resistance is at 97.30 and 97.55.
Additional key levels
