- DXY (US Dollar Index) is losing steam after hitting new 2019 highs on Tuesday.
- The level to beat for bears are seen at the 94.42 and 98.20 support levels.
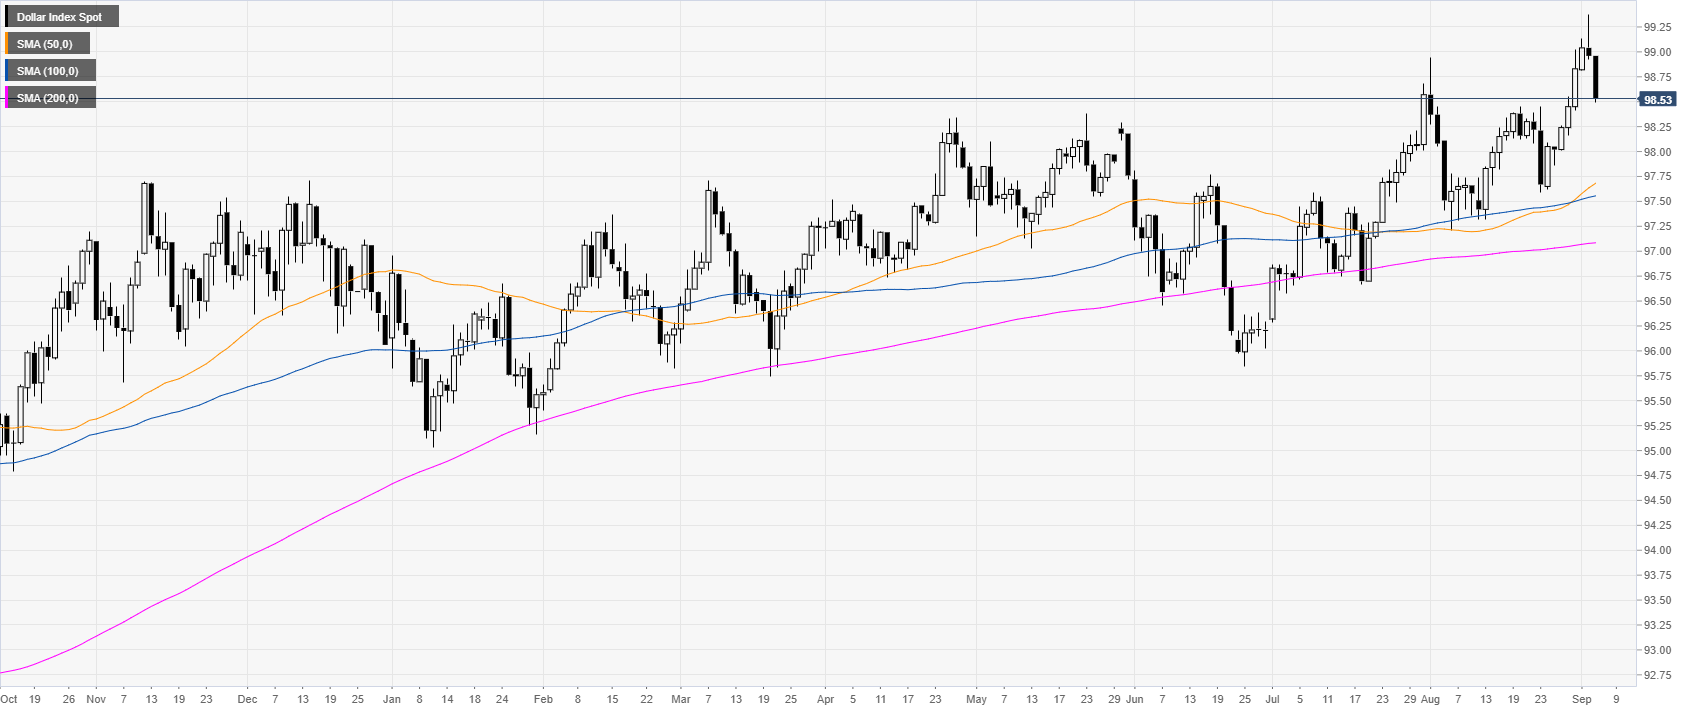
DXY daily chart
DXY (US Dollar Index) is trading in a bull trend above the main daily simple moving averages (DSMAs). The market is correcting down after hitting new 2019 highs on Tuesday.
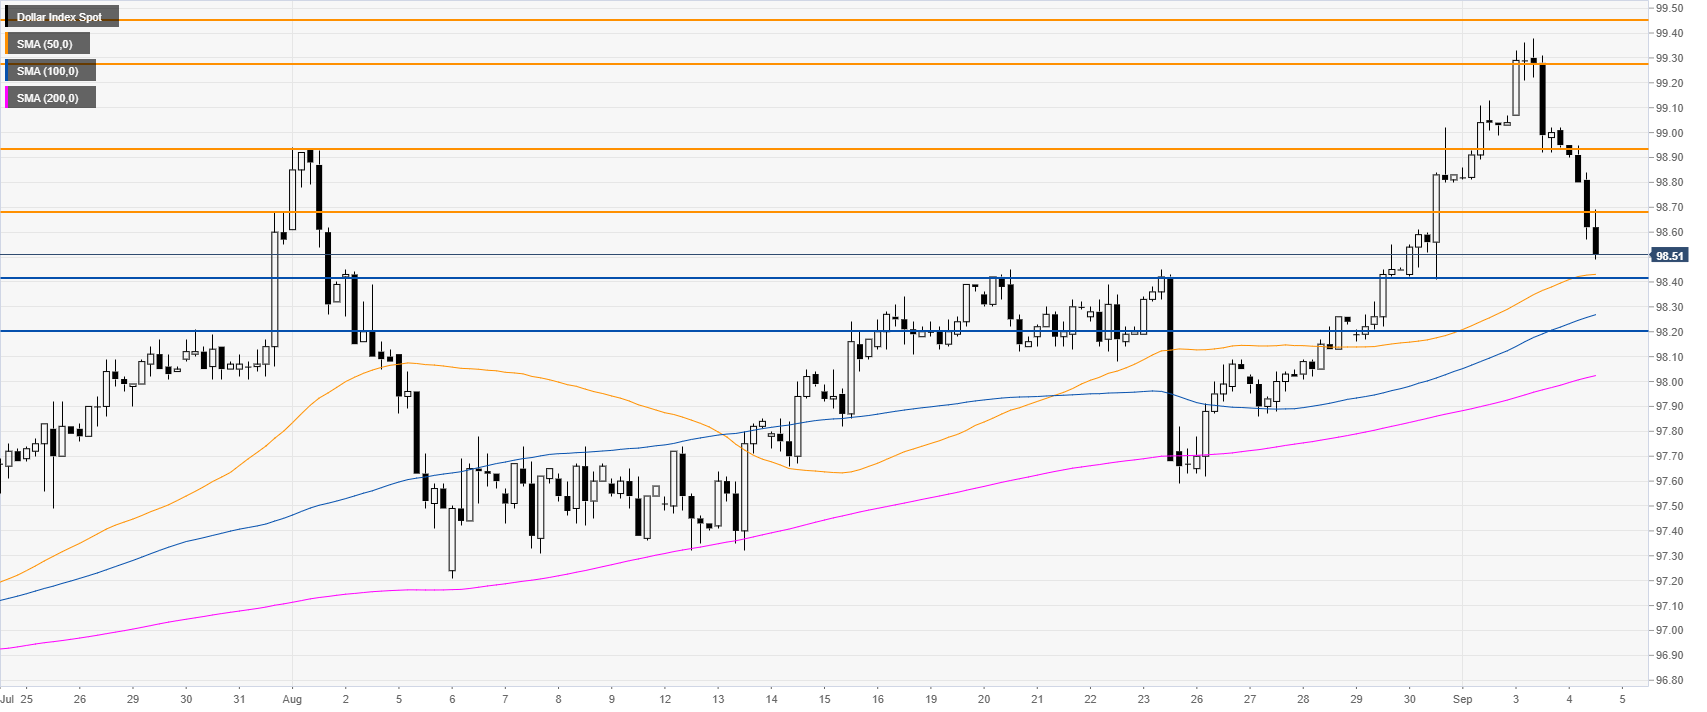
DXY four-hour chart
This Wednesday, the Greenback is under bearish pressure below the 98.68 resistance. The market is set to continue declining towards 98.42 and 98.20 support levels in the medium term.
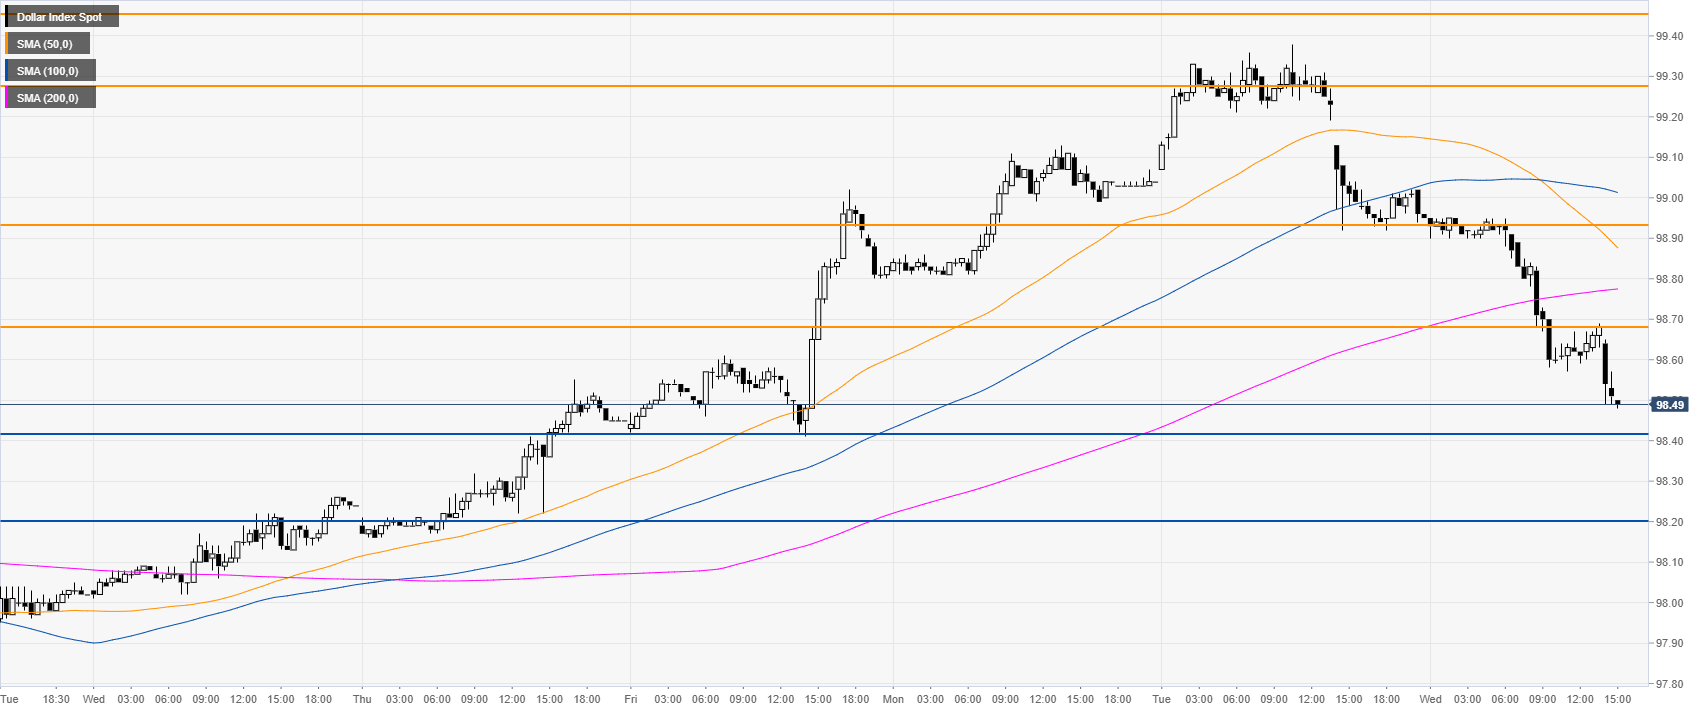
DXY 30-minute chart
DXY is under bearish pressure below its main SMAs. Immediate resistances are seen at the 98.68 and 98.94 levels.
Additional key levels
