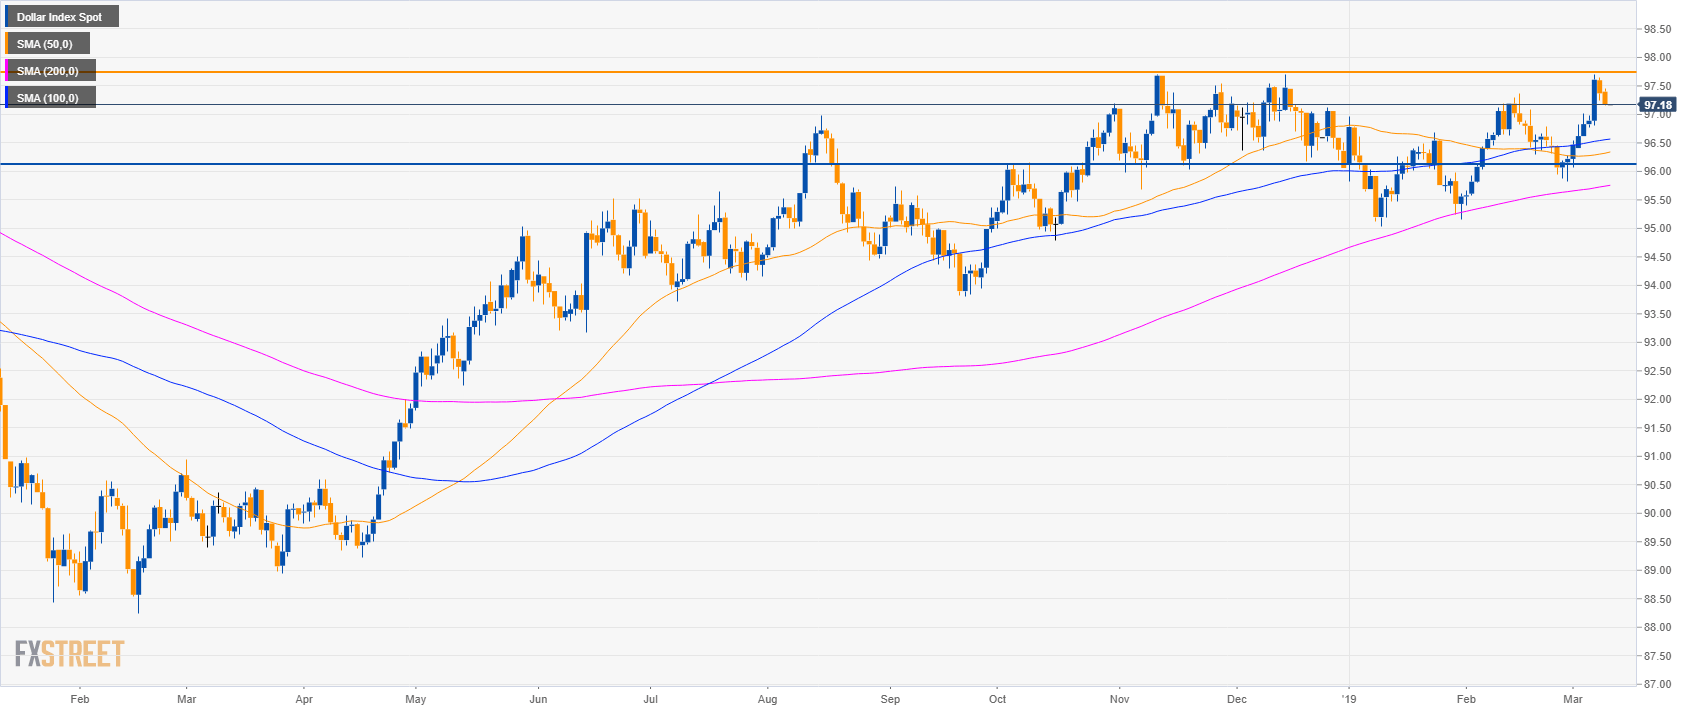
DXY daily chart
- The US Dollar Index (DXY) is trading in a bull trend above its main simple moving averages.
- Bulls have not been able to sustain prices above the 2018 and 2019 highs.
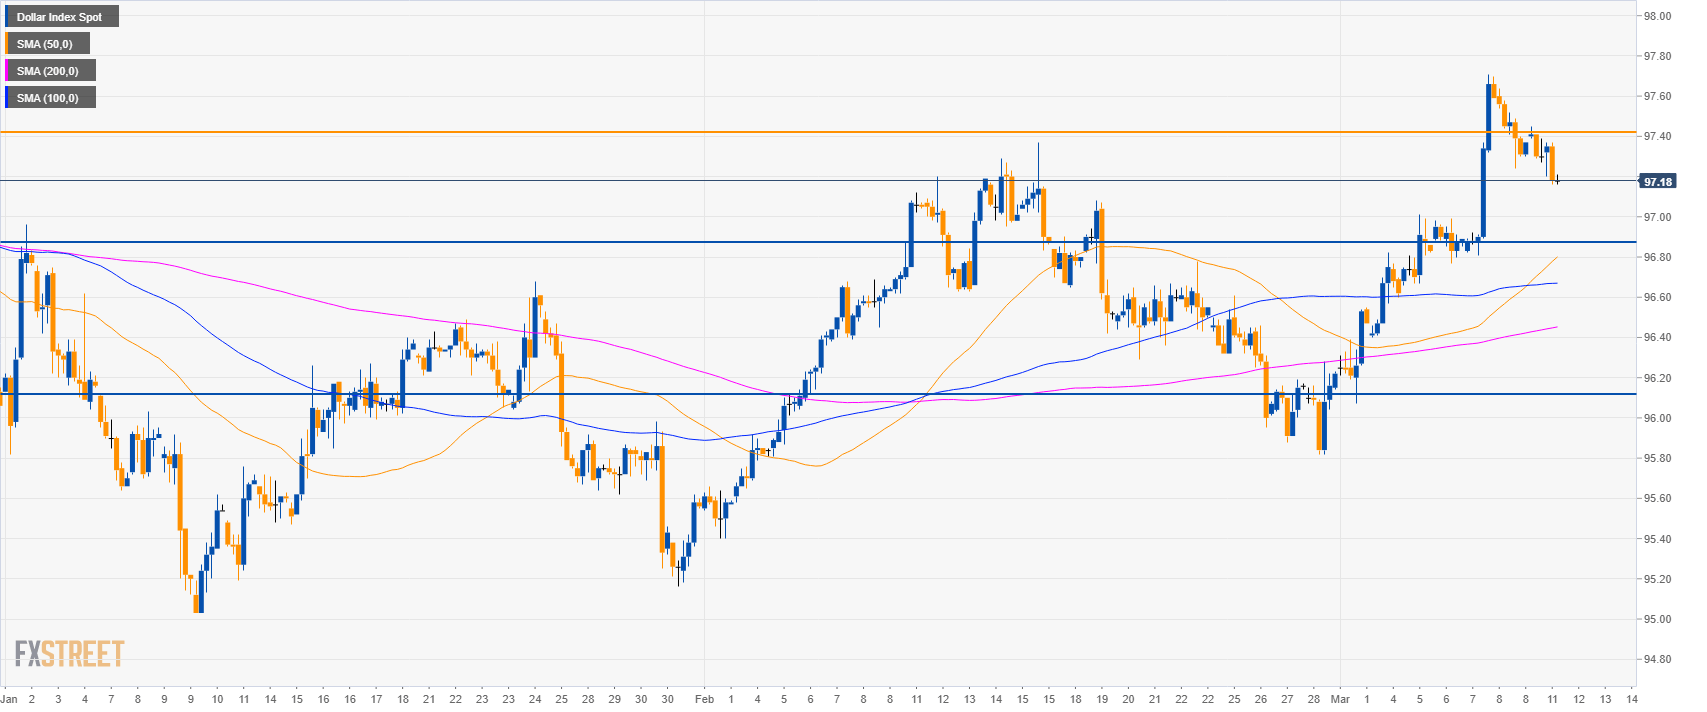
DXY 4-hour chart
- DXY is trading above its main SMAs suggesting bullish momentum in the medium-term.
- However, the break below 97.40 resistance can lead to a bearish move down to 96.87 support.
Additional key levels
Dollar Index Spot
Overview:
Today Last Price: 97.18
Today Daily change: -0.19 points
Today Daily change %: -0.20%
Today Daily Open: 97.37
Trends:
Daily SMA20: 96.73
Daily SMA50: 96.3
Daily SMA100: 96.54
Daily SMA200: 95.73
Levels:
Previous Daily High: 97.64
Previous Daily Low: 97.24
Previous Weekly High: 97.71
Previous Weekly Low: 96.4
Previous Monthly High: 97.37
Previous Monthly Low: 95.4
Daily Fibonacci 38.2%: 97.39
Daily Fibonacci 61.8%: 97.49
Daily Pivot Point S1: 97.19
Daily Pivot Point S2: 97.02
Daily Pivot Point S3: 96.79
Daily Pivot Point R1: 97.59
Daily Pivot Point R2: 97.82
Daily Pivot Point R3: 97.99
