- DXY is advancing little this Monday supported by the 200 DSMA.
- The level to beat for bulls is 97.00 and 97.15.
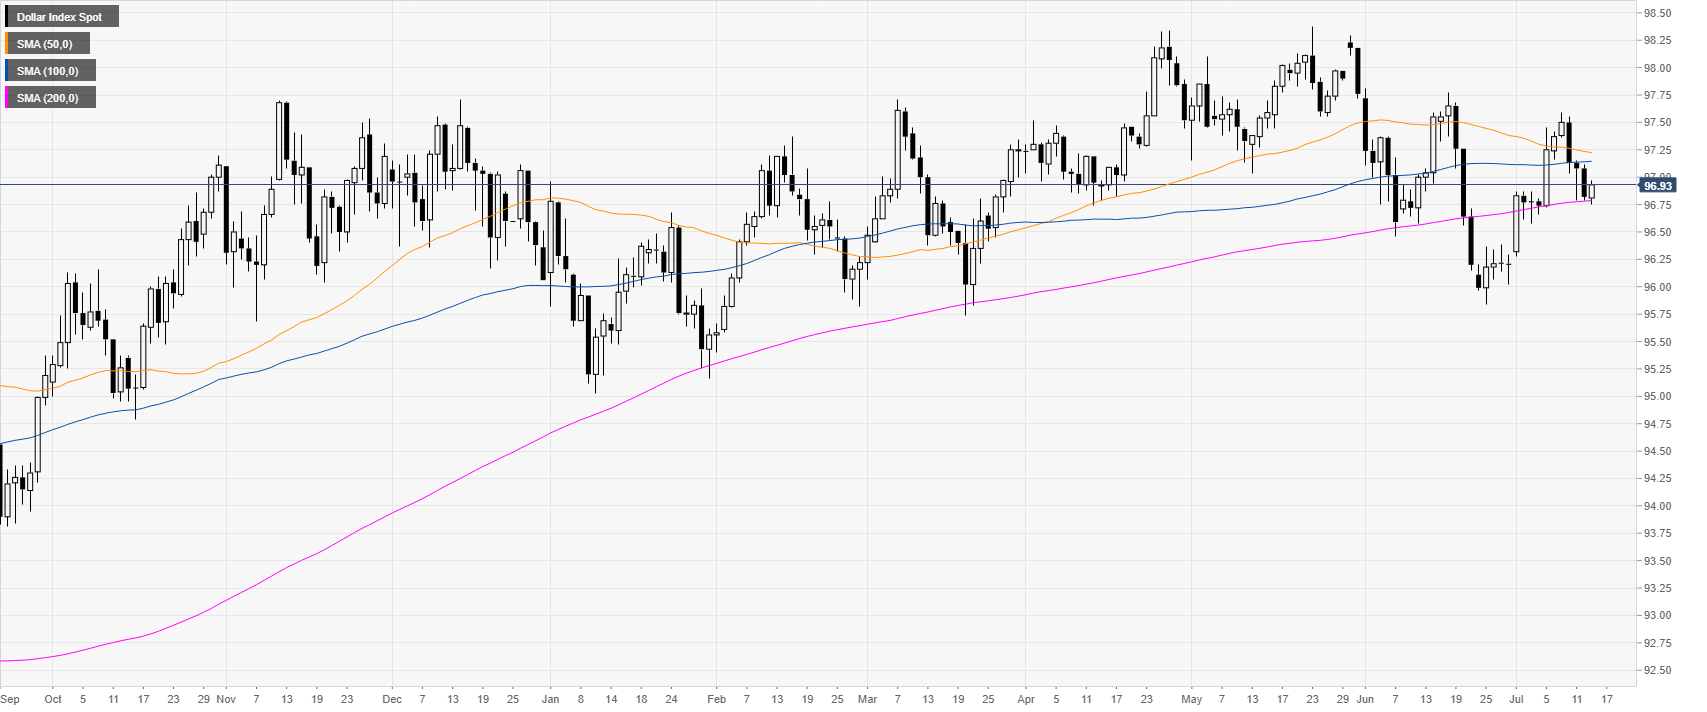
DXY daily chart
The US Dollar Index (DXY) is trading in a bull trend just above the 200-day simple moving average (DSMA).
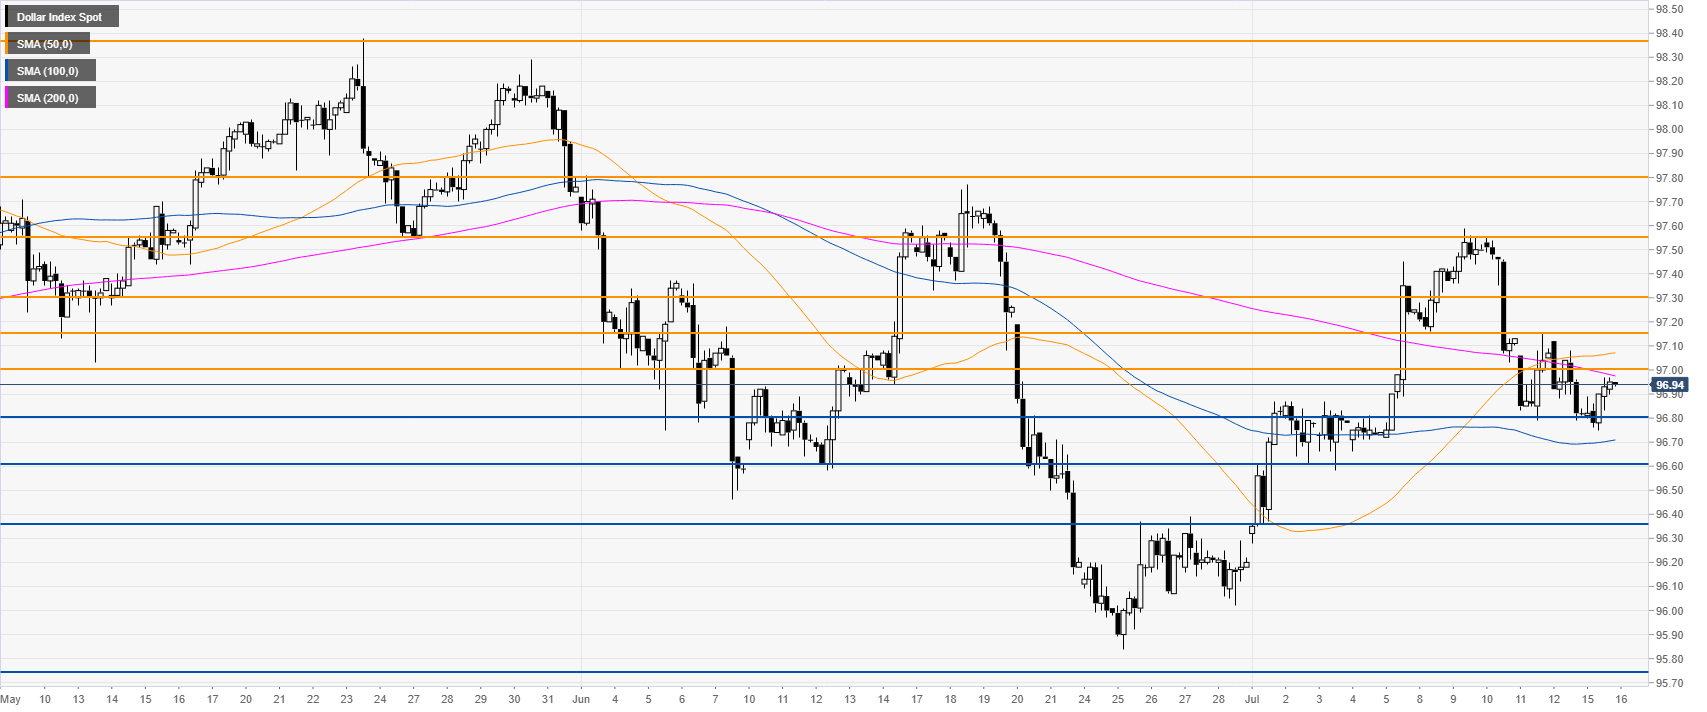
DXY 4-hour chart
The market is in consolidation mode between the 100 and 200 SMAs. Bulls would need a break above 97.00 and 97.15 to get out of the woods.
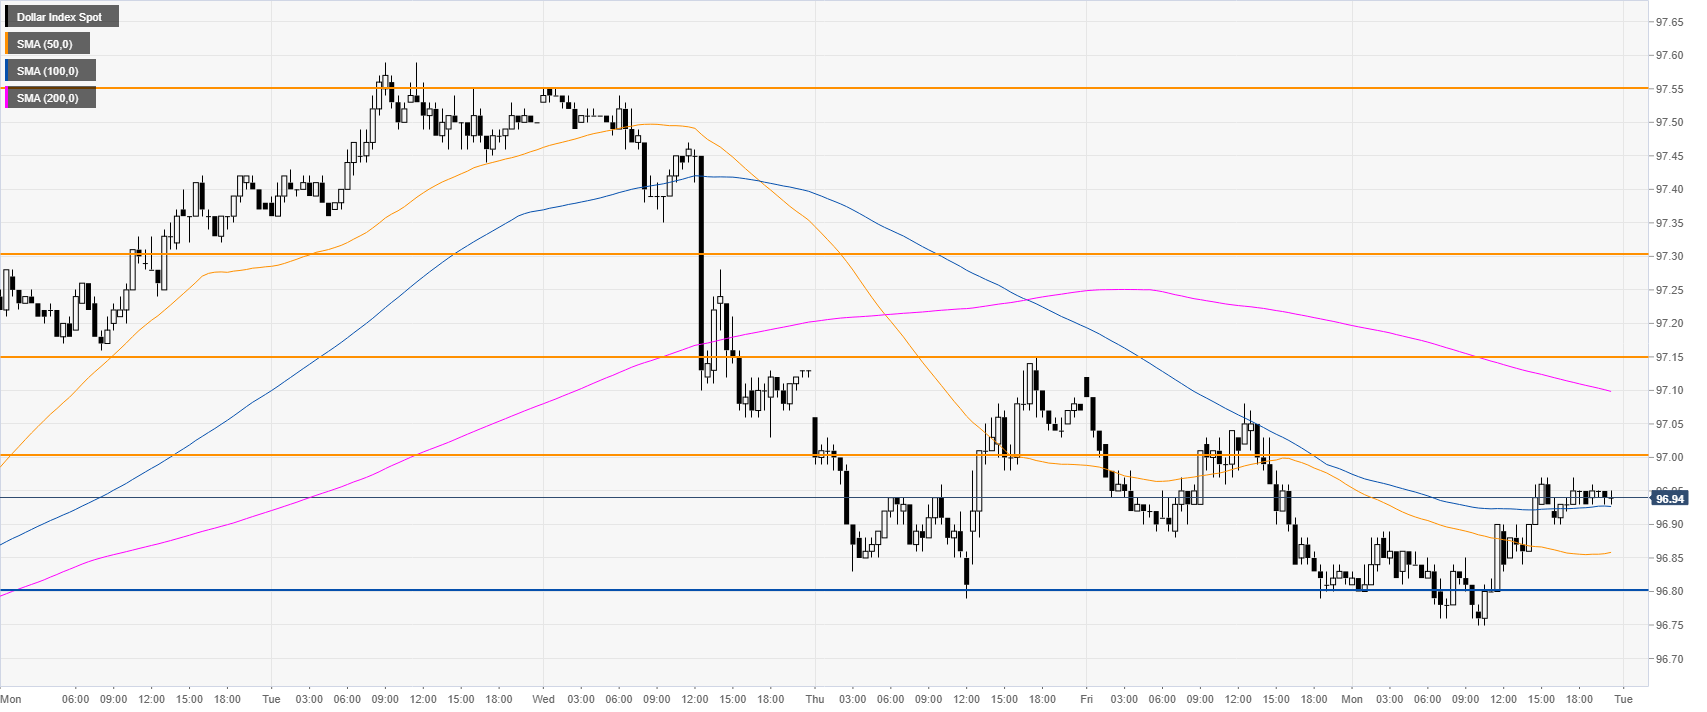
DXY 30-minute chart
DXY got a small boost this Monday above the 96.80 support and the 50/100 SMAs. If bulls can overcome 97.15 resistance the 97.30 and 97.55 can come into play.

Additional key levels