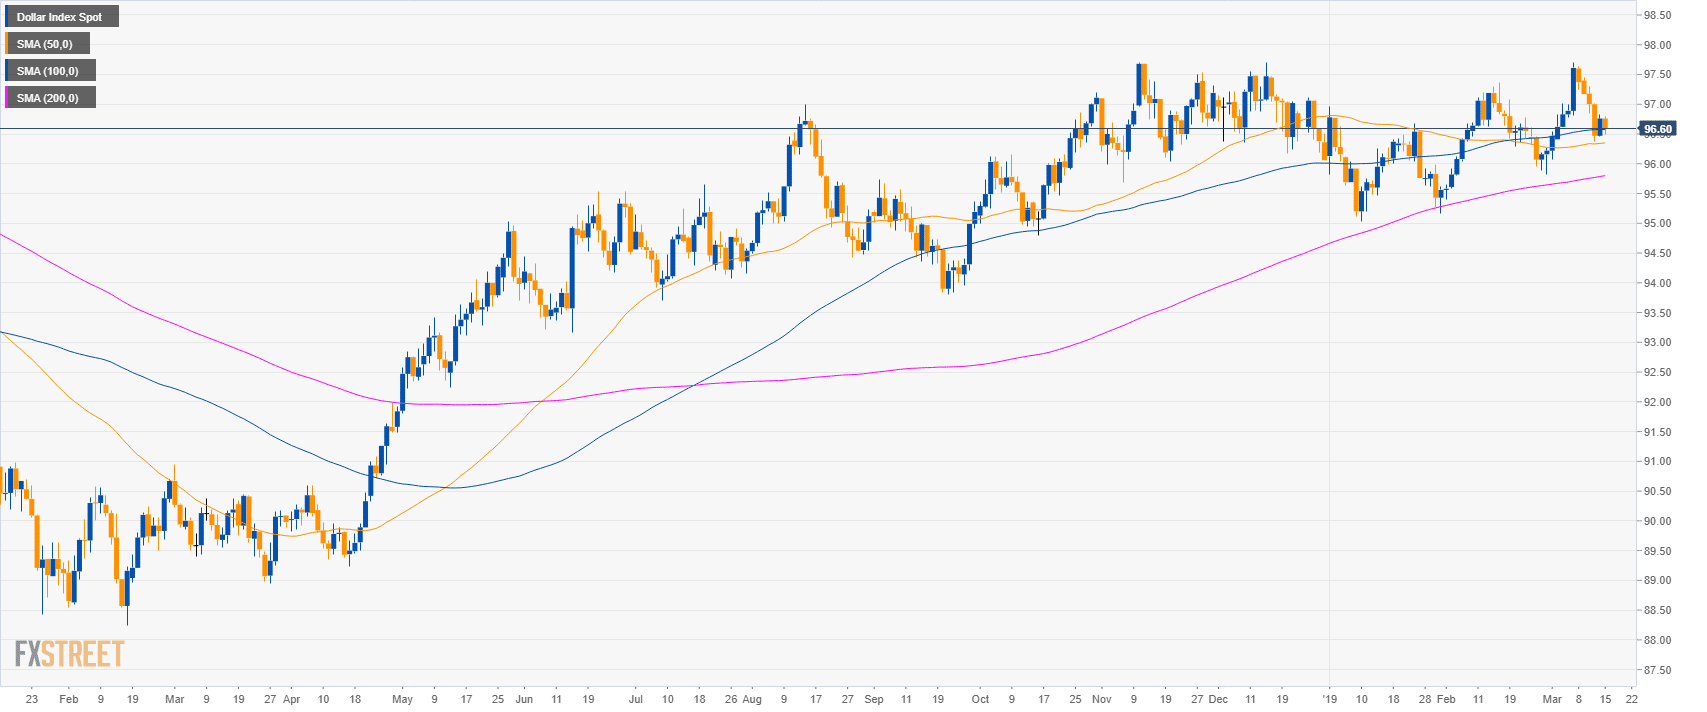
DXY daily chart
- The US Dollar Index (DXY) is trading in a bull trend above its 200-day simple moving average.
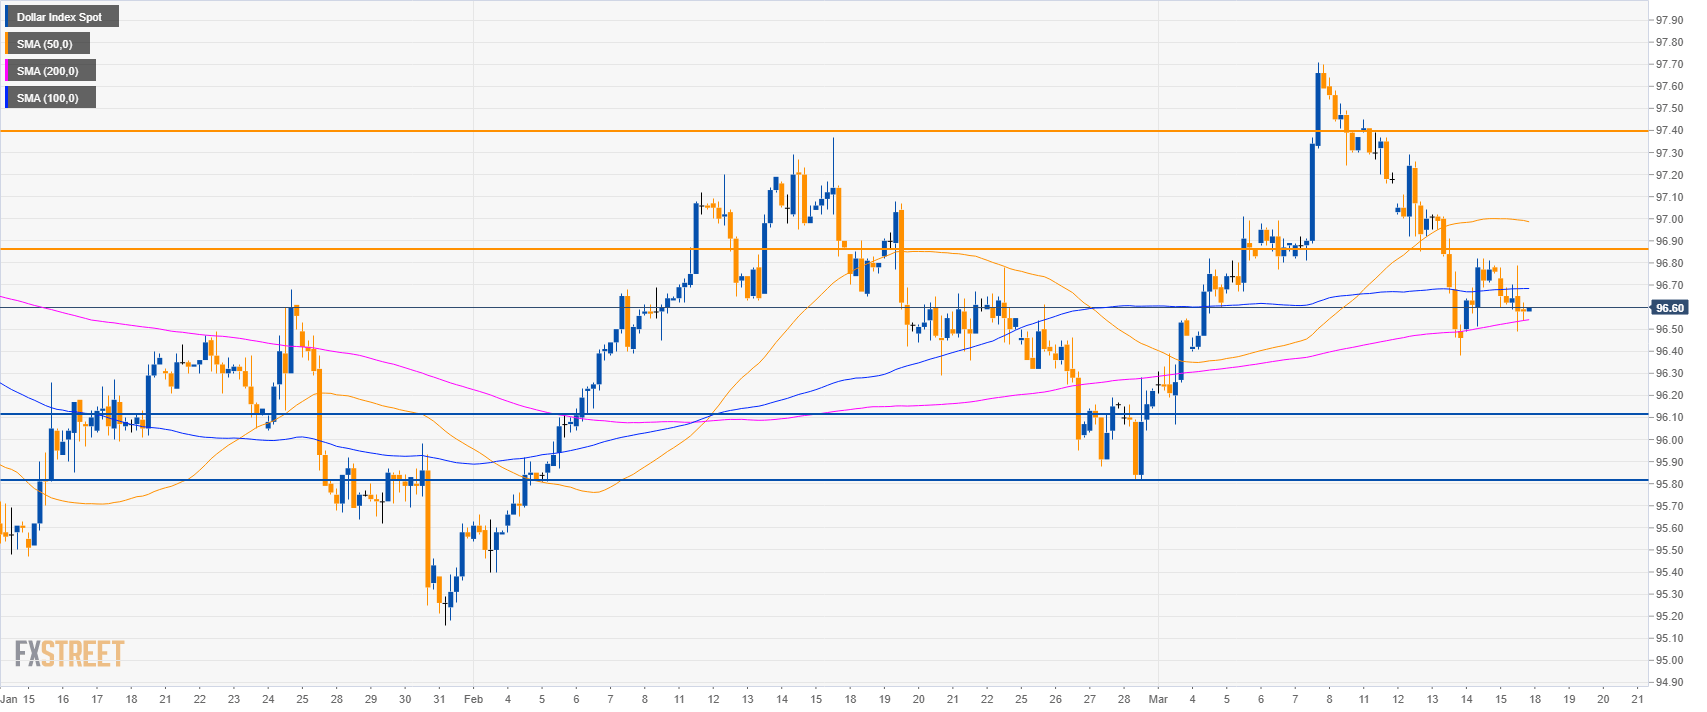
DXY 4-hour chart
- DXY is trading between the 100 and 200 SMAs suggesting a consolidation in the medium-term.
- DXY is bearish below 96.87 resistance. Key supports to the downside are at 96.10 and 95.82 level.
- Resistances are at 96.87 and 97.40 level.
Additional key levels
Dollar Index Spot
Overview:
Today Last Price: 96.58
Today Daily change: -0.18 ticks
Today Daily change %: -0.19%
Today Daily Open: 96.76
Trends:
Daily SMA20: 96.7
Daily SMA50: 96.34
Daily SMA100: 96.58
Daily SMA200: 95.79
Levels:
Previous Daily High: 96.82
Previous Daily Low: 96.46
Previous Weekly High: 97.71
Previous Weekly Low: 96.4
Previous Monthly High: 97.37
Previous Monthly Low: 95.4
Daily Fibonacci 38.2%: 96.68
Daily Fibonacci 61.8%: 96.6
Daily Pivot Point S1: 96.54
Daily Pivot Point S2: 96.32
Daily Pivot Point S3: 96.18
Daily Pivot Point R1: 96.9
Daily Pivot Point R2: 97.04
Daily Pivot Point R3: 97.26
