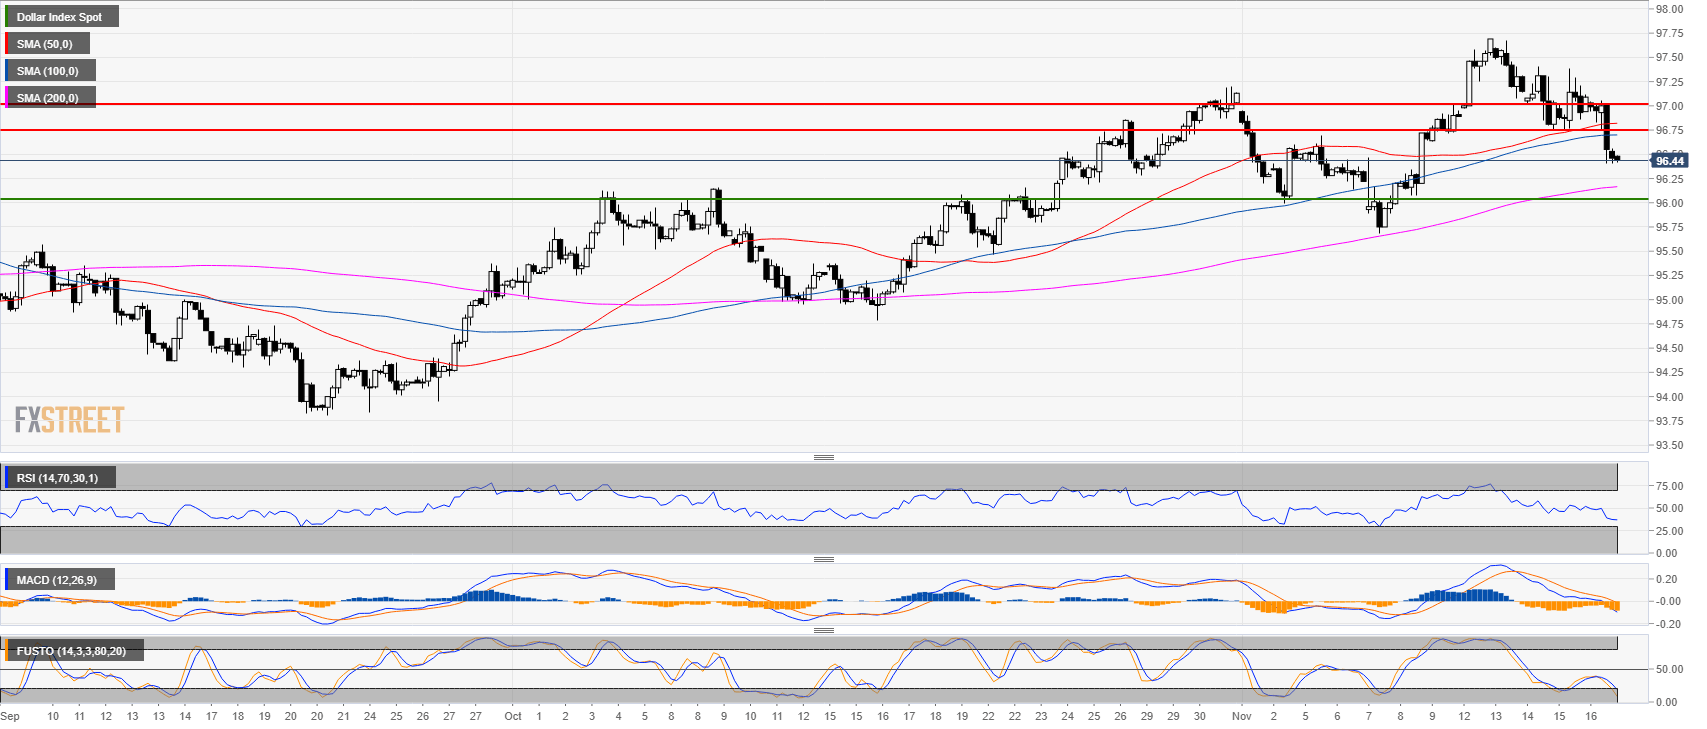
DXY daily chart
- The US Dollar Index (DXY) is pulling back down after the market formed a 5-wave Elliot pattern.
-636779997044583331.png)
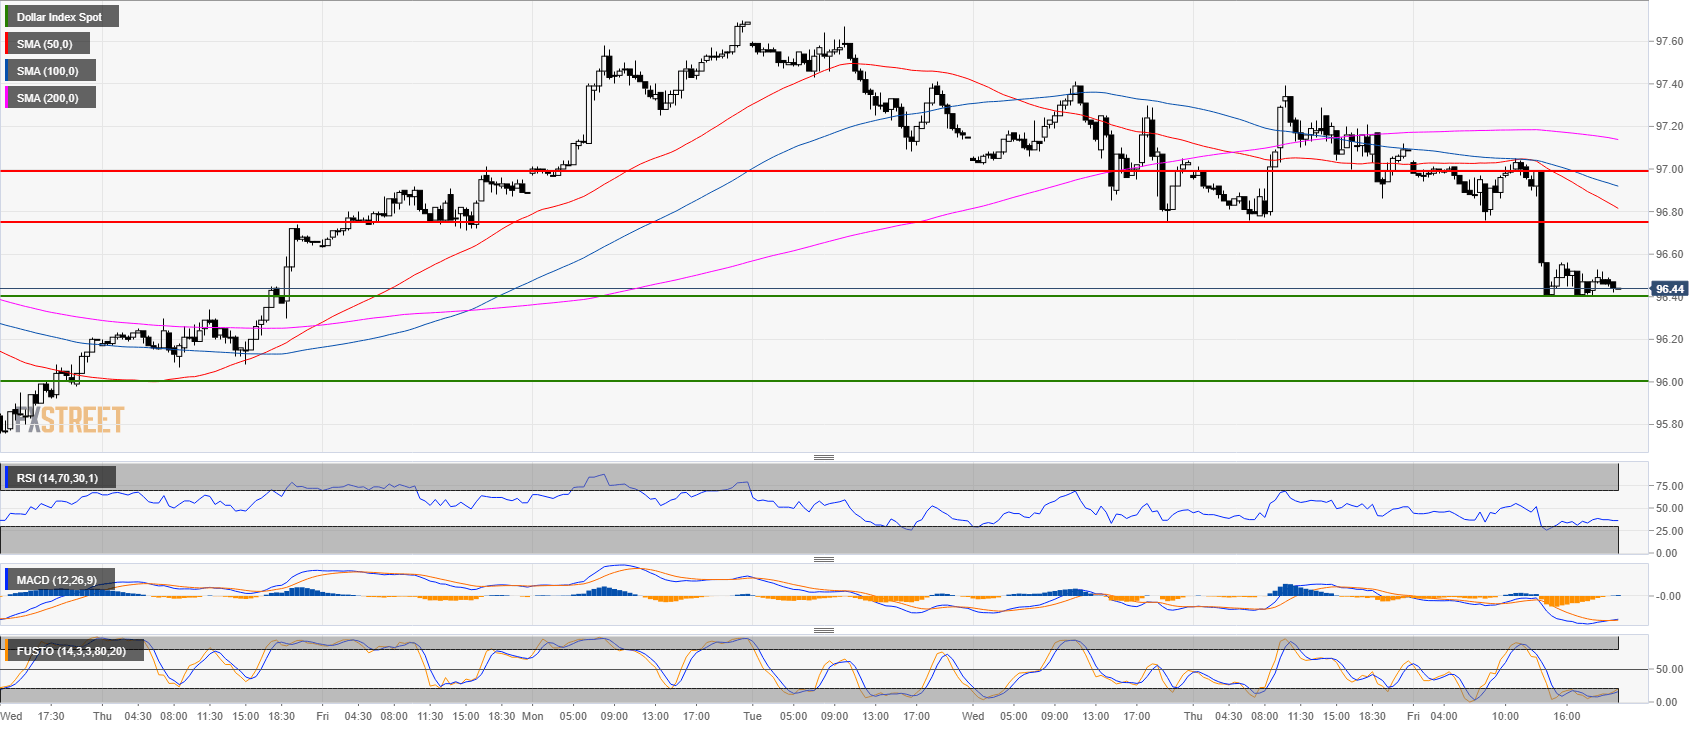
DXY 4-hour chart
- DXY broke below the 50 and 100-period simple moving averages.
- Bears should keep the market below 96.75 and 97.00 figure to keep the bearish momentum going.
DXY 30-minute chart
- A break below 96.40 should open the doors to the 96.00 figure
Additional key levels at a glance:
Dollar Index Spot
Overview:
Last Price: 96.44
Daily change: -65 pips
Daily change: -0.669%
Daily Open: 97.09
Trends:
Daily SMA20: 96.6
Daily SMA50: 95.68
Daily SMA100: 95.36
Daily SMA200: 93.5
Levels:
Daily High: 97.39
Daily Low: 96.76
Weekly High: 97.01
Weekly Low: 95.68
Monthly High: 97.2
Monthly Low: 94.79
Daily Fibonacci 38.2%: 97.15
Daily Fibonacci 61.8%: 97
Daily Pivot Point S1: 96.77
Daily Pivot Point S2: 96.45
Daily Pivot Point S3: 96.14
Daily Pivot Point R1: 97.4
Daily Pivot Point R2: 97.71
Daily Pivot Point R3: 98.03
