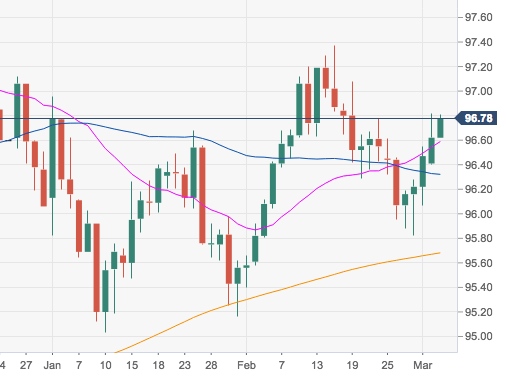
- The greenback is advancing further in the first half of the week and is approaching the critical handle at 97.00 the figure.
- Immediate above lies the 23.6% Fibo retracement of the September-December up move at 96.79.
- A clear break above this level should open the door for further upside as long as the 200-day SMA at 95.68 underpins.
DXY daily chart
Dollar Index Spot
Overview:
Today Last Price: 96.74
Today Daily change: 15 pips
Today Daily change %: 0.12%
Today Daily Open: 96.62
Trends:
Daily SMA20: 96.58
Daily SMA50: 96.27
Daily SMA100: 96.47
Daily SMA200: 95.67
Levels:
Previous Daily High: 96.82
Previous Daily Low: 96.4
Previous Weekly High: 96.61
Previous Weekly Low: 95.82
Previous Monthly High: 97.37
Previous Monthly Low: 95.4
Daily Fibonacci 38.2%: 96.66
Daily Fibonacci 61.8%: 96.56
Daily Pivot Point S1: 96.41
Daily Pivot Point S2: 96.19
Daily Pivot Point S3: 95.99
Daily Pivot Point R1: 96.83
Daily Pivot Point R2: 97.03
Daily Pivot Point R3: 97.25
