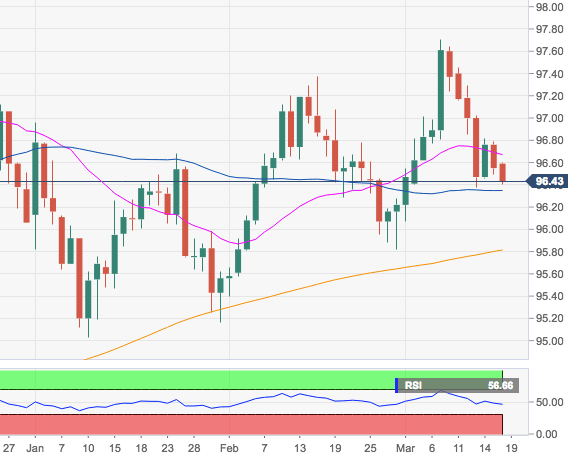
- The index is adding to Friday’s weakness and remains on the way to a potential visit of the key 55-day SMA, today at 96.33.
- Further south is expected to test the 95.80 region, where coincide late-February lows and the critical 200-day SMA.
- That said, the constructive view on DXY is expected to persist as long as the 200-day SMA underpins.
DXY daily chart
Dollar Index Spot
Overview:
Today Last Price: 96.41
Today Daily change: 20 pips
Today Daily change %: -0.15%
Today Daily Open: 96.55
Trends:
Daily SMA20: 96.68
Daily SMA50: 96.35
Daily SMA100: 96.57
Daily SMA200: 95.8
Levels:
Previous Daily High: 96.79
Previous Daily Low: 96.49
Previous Weekly High: 97.45
Previous Weekly Low: 96.38
Previous Monthly High: 97.37
Previous Monthly Low: 95.4
Daily Fibonacci 38.2%: 96.6
Daily Fibonacci 61.8%: 96.68
Daily Pivot Point S1: 96.43
Daily Pivot Point S2: 96.31
Daily Pivot Point S3: 96.13
Daily Pivot Point R1: 96.73
Daily Pivot Point R2: 96.91
Daily Pivot Point R3: 97.03
