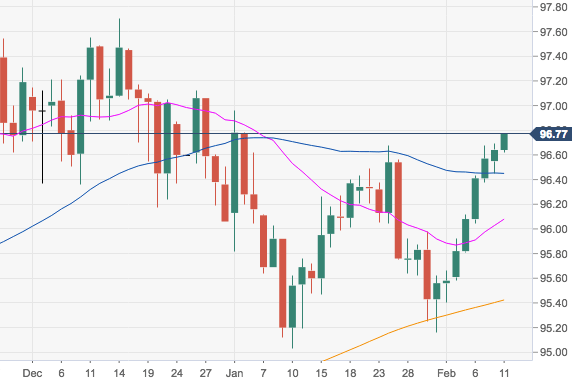
- The index is navigating fresh 6-week tops around the Fibo retracement near 96.80 so far today, paving the way for a potential visit to yearly tops in the 97.00 neighbourhood.
- Extra upside on a clear of this area are expected to meet 2018 highs around 97.70 recorded in mid-December.
- The positive view on the buck remains unchanged while above the 200-day SMA at 95.41. This relevant area of support is also reinforced by a Fibo retracement of the September-December rally at 95.30 and recent lows at 95.16.
DXY daily chart
Dollar Index Spot
Overview:
Today Last Price: 96.75
Today Daily change: 16 pips
Today Daily change %: 0.11%
Today Daily Open: 96.64
Trends:
Daily SMA20: 96.04
Daily SMA50: 96.4
Daily SMA100: 96.24
Daily SMA200: 95.4
Levels:
Previous Daily High: 96.69
Previous Daily Low: 96.45
Previous Weekly High: 96.69
Previous Weekly Low: 95.58
Previous Monthly High: 96.96
Previous Monthly Low: 95.03
Daily Fibonacci 38.2%: 96.6
Daily Fibonacci 61.8%: 96.54
Daily Pivot Point S1: 96.5
Daily Pivot Point S2: 96.35
Daily Pivot Point S3: 96.26
Daily Pivot Point R1: 96.74
Daily Pivot Point R2: 96.83
Daily Pivot Point R3: 96.98
