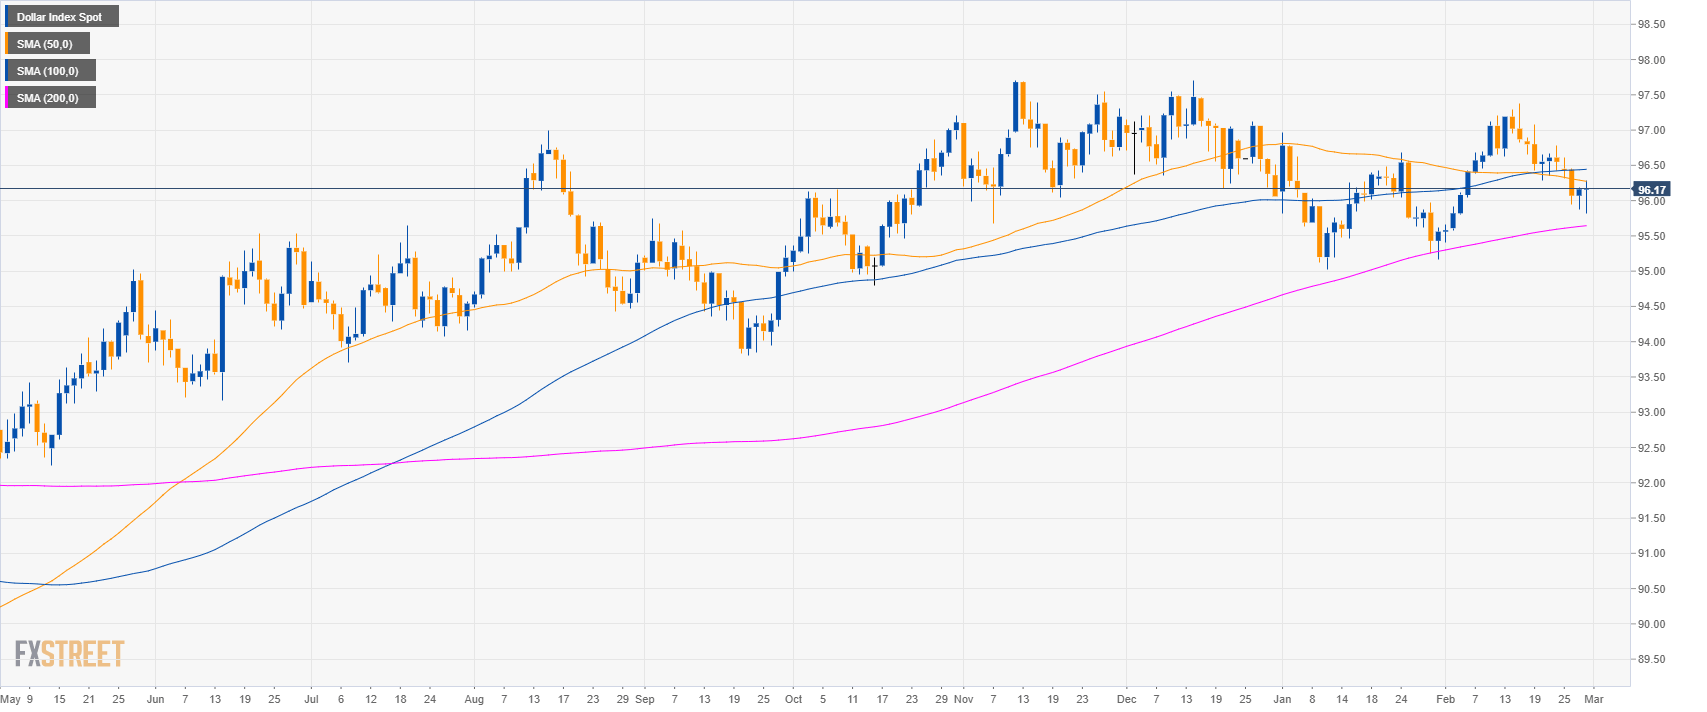
DXY daily chart
- The US Dollar Index (DXY) is trading in a bull trend above its 200-day simple moving averages (SMA).
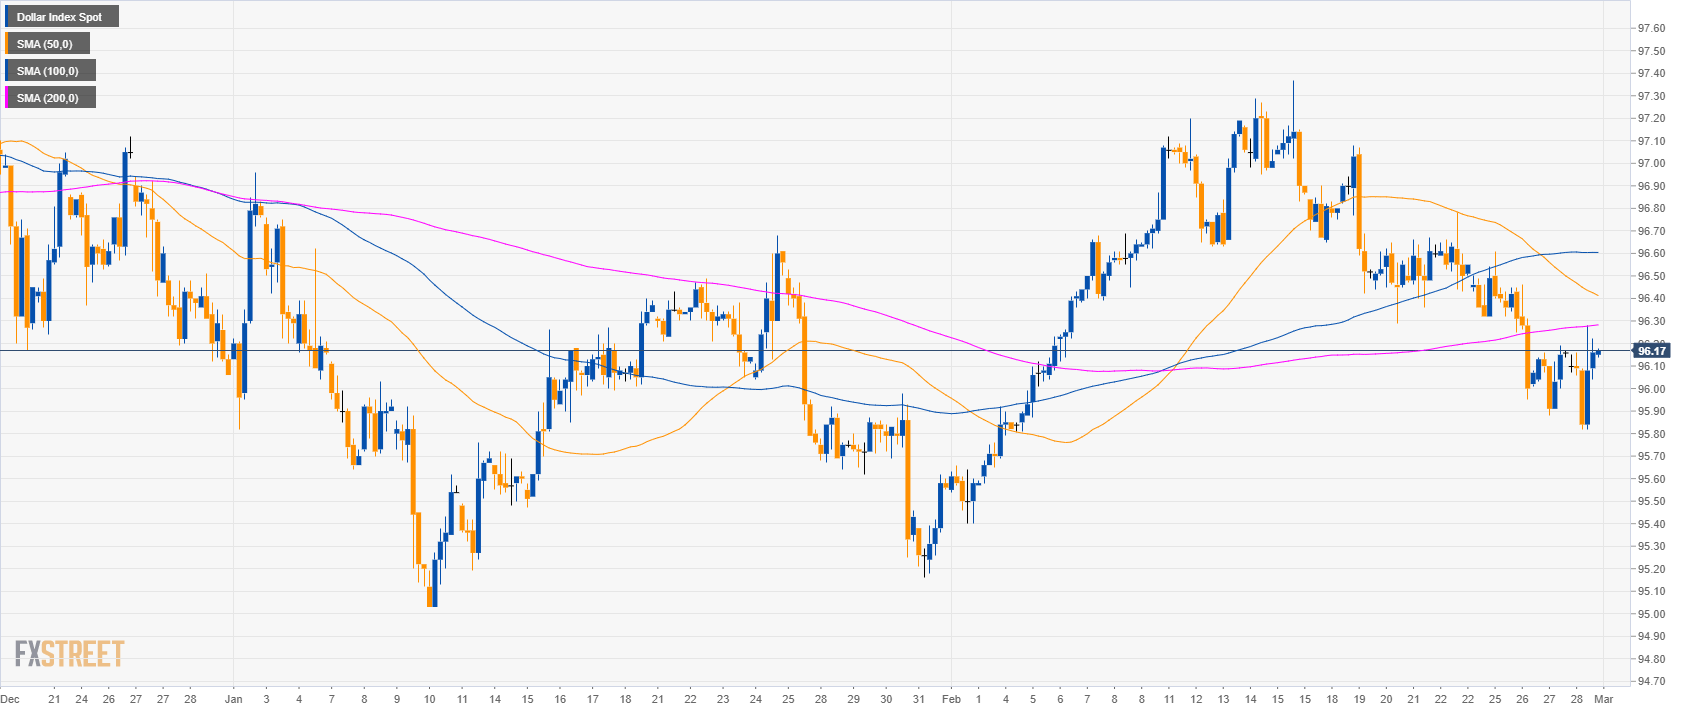
DXY 4-hour chart
- DXY is trading below its main SMAs suggesting bearish momentum in the medium-term.
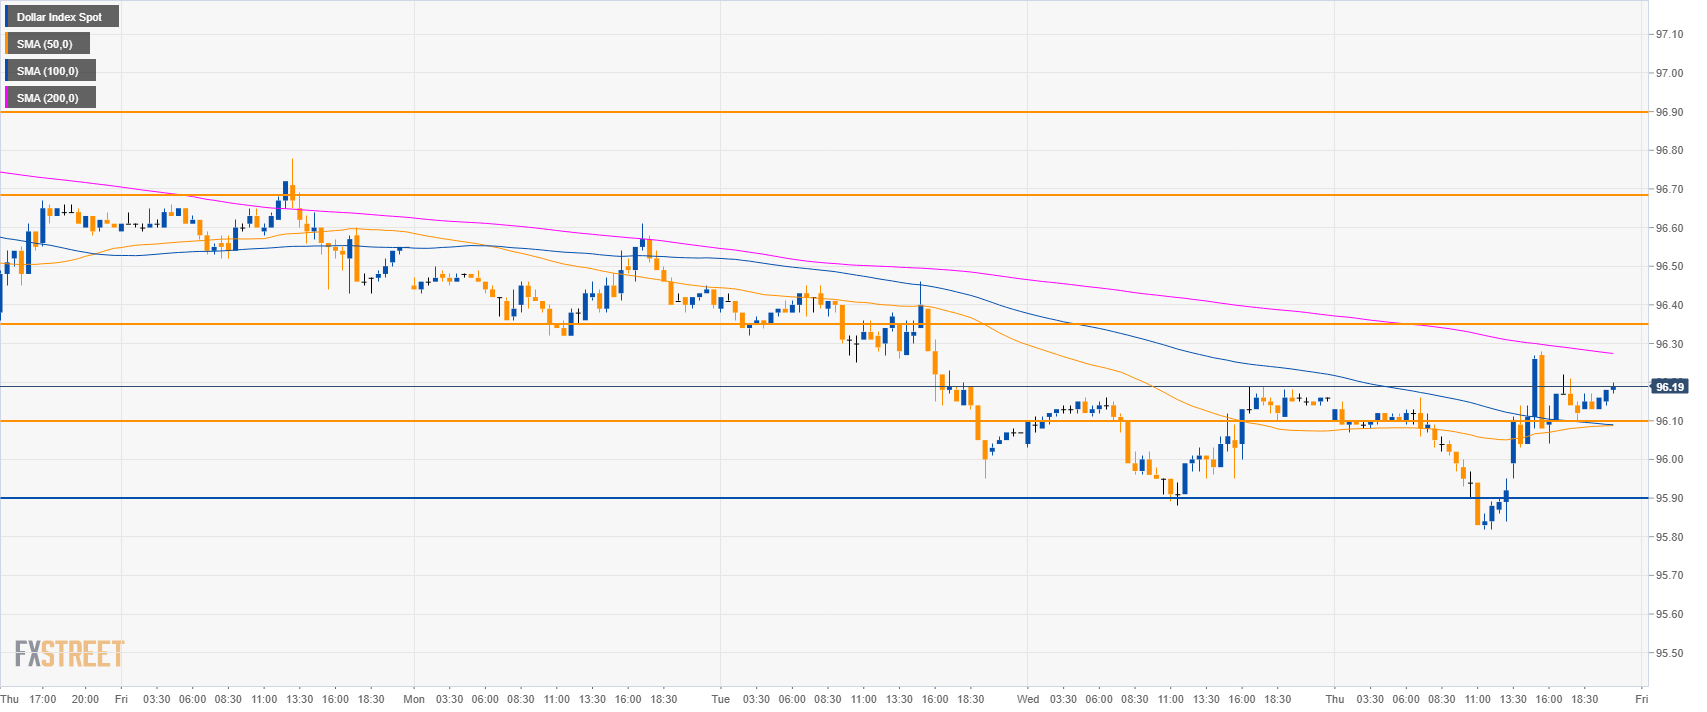
DXY 30-minute chart
- DXY broke above 96.10 and the 50 and 100 SMAs opening up the doors to 96.35 resistance.
- DXY is trading below its 200 SMA and a break below 96.10 would lead to 95.90 and potentially all the way down to 95.40 level.
Additional key levels
Dollar Index Spot
Overview:
Today Last Price: 96.18
Today Daily change %: 0.02%
Today Daily Open: 96.16
Trends:
Daily SMA20: 96.46
Daily SMA50: 96.29
Daily SMA100: 96.44
Daily SMA200: 95.63
Levels:
Previous Daily High: 96.19
Previous Daily Low: 95.88
Previous Weekly High: 97.08
Previous Weekly Low: 96.29
Previous Monthly High: 96.96
Previous Monthly Low: 95.03
Daily Fibonacci 38.2%: 96.07
Daily Fibonacci 61.8%: 96
Daily Pivot Point S1: 95.96
Daily Pivot Point S2: 95.77
Daily Pivot Point S3: 95.65
Daily Pivot Point R1: 96.27
Daily Pivot Point R2: 96.39
Daily Pivot Point R3: 96.58
