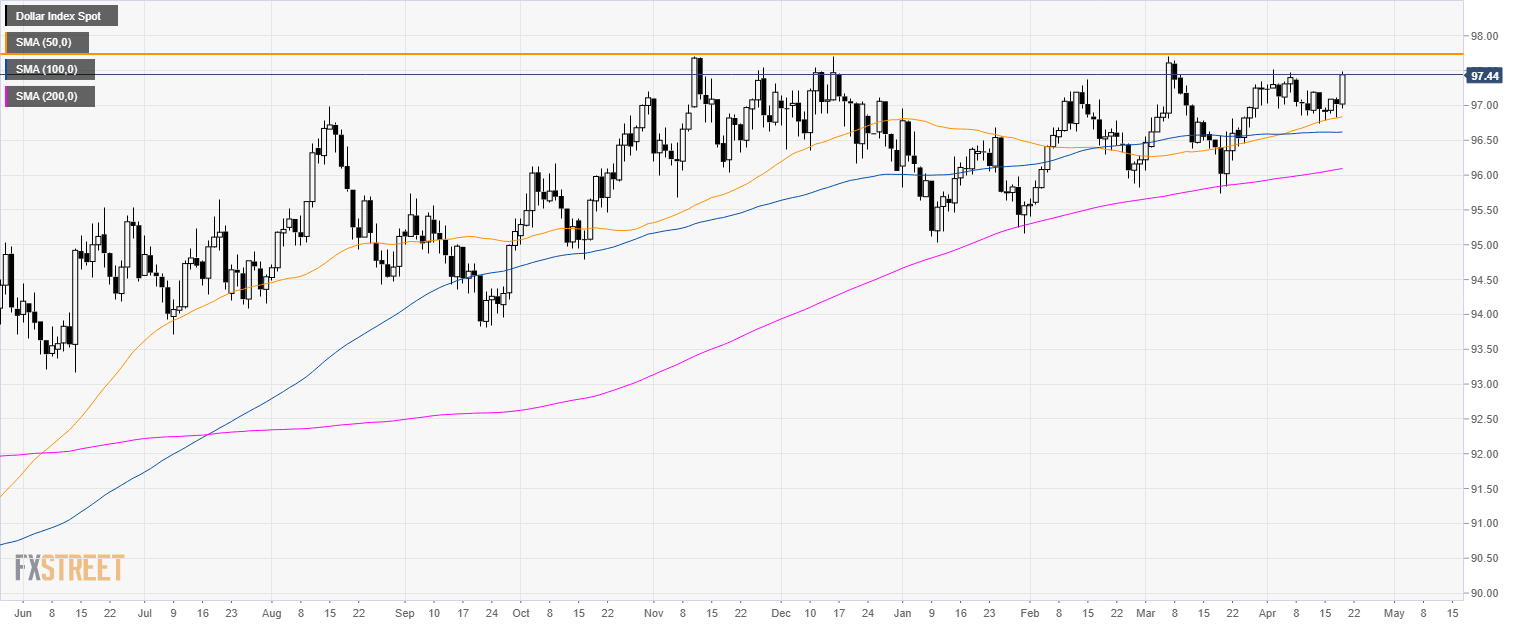
DXY daily chart
- The US Dollar Index (DXY) is trading in a bull trend above its 200-day simple moving average (SMA).
- As discussed yesterday, DXY had another leg up above 97.00 the figure.
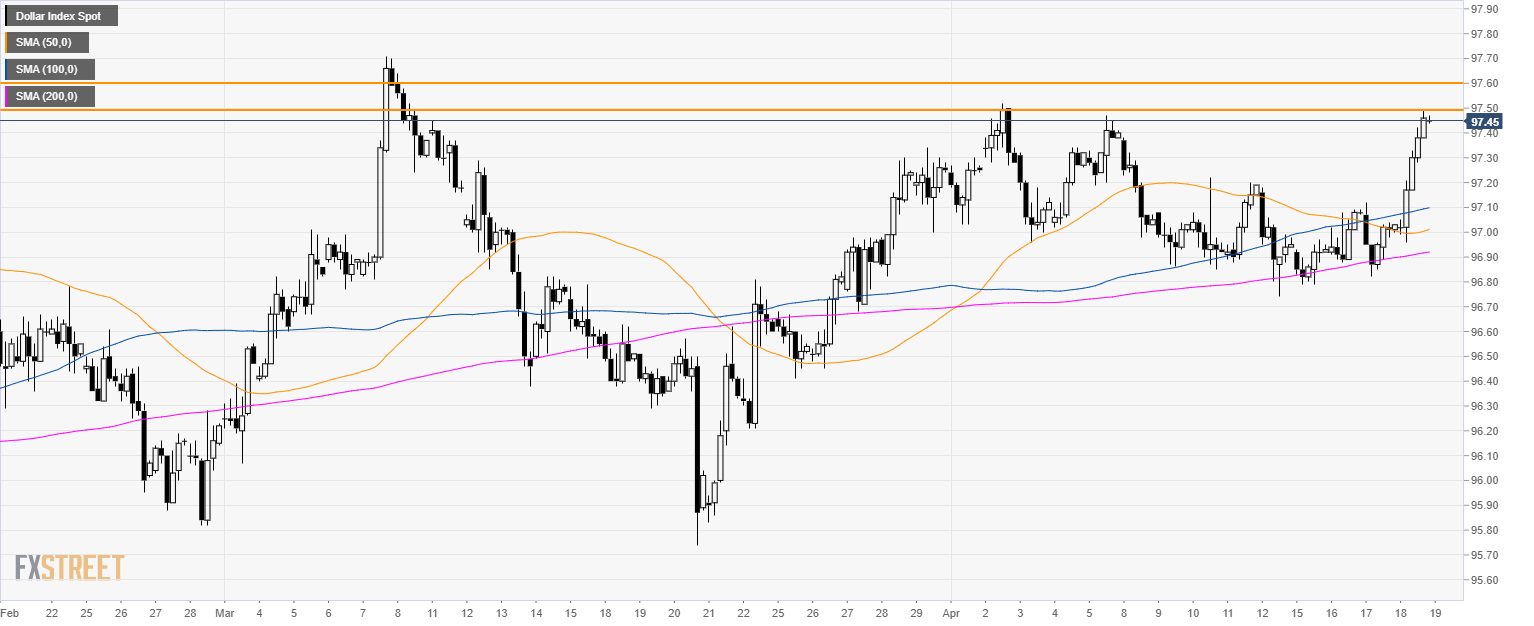
DXY 4-hour chart
- DXY is finding resistance at 97.50 level.
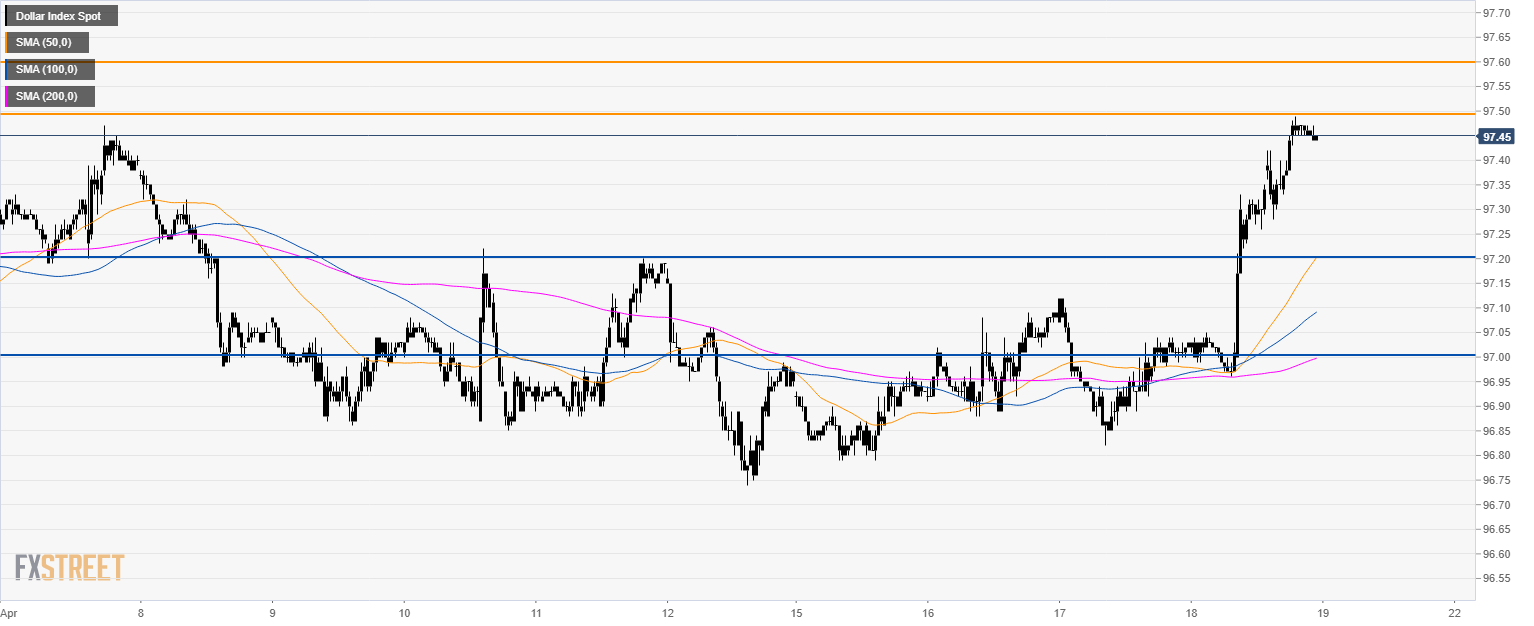
DXY 30-minute chart
- Bulls would need to overcome 97.50/60 resistance if they want to revist the 2019 high at 97.70.
- Next week, bears will most likely be driving DXY to 97.20 and 97.00 key support.
Additional key levels
