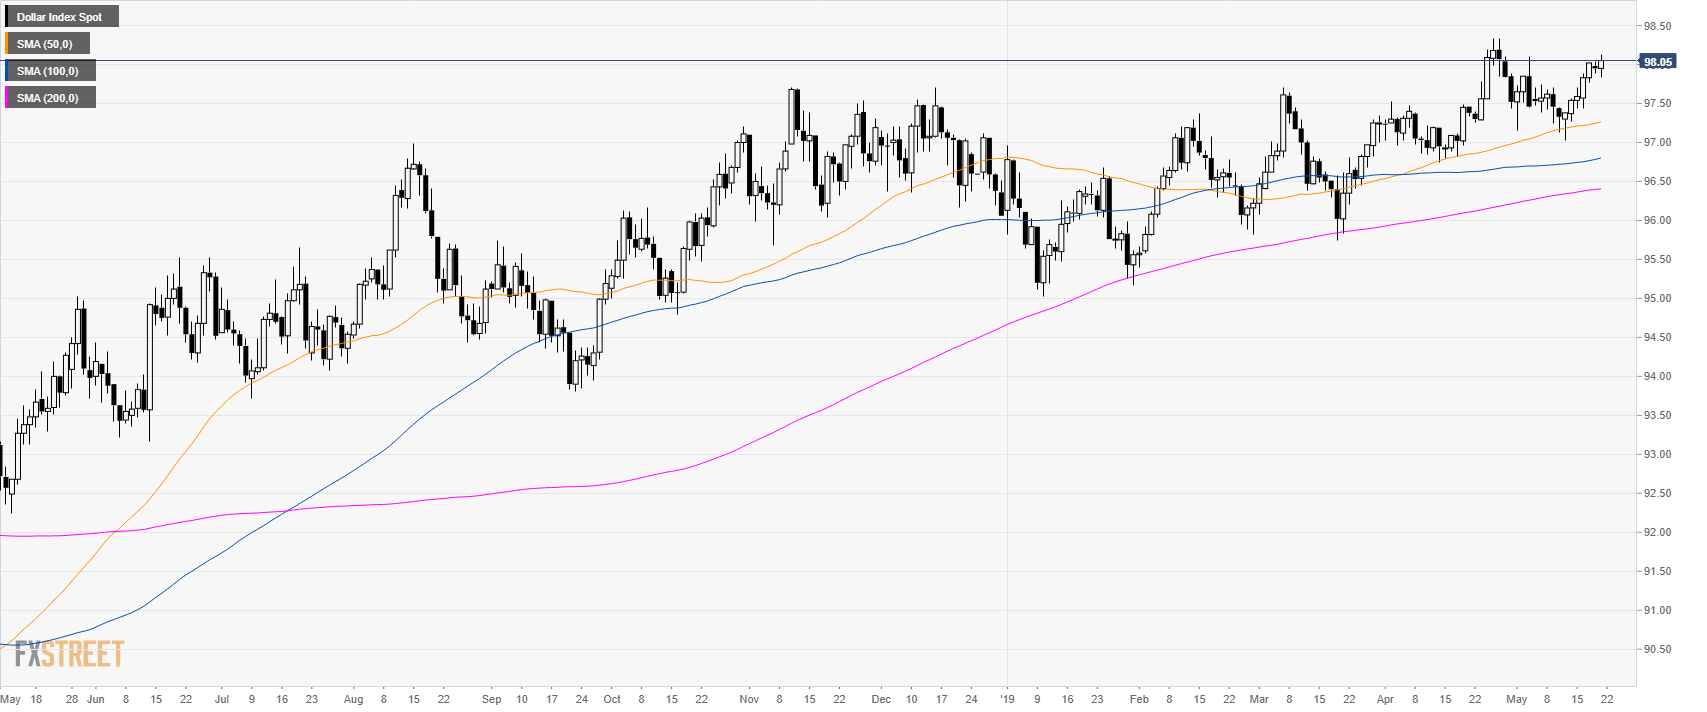
DXY daily chart
The US Dollar Index (DXY) is trading in a bull trend above its main simple moving averages (SMAs).
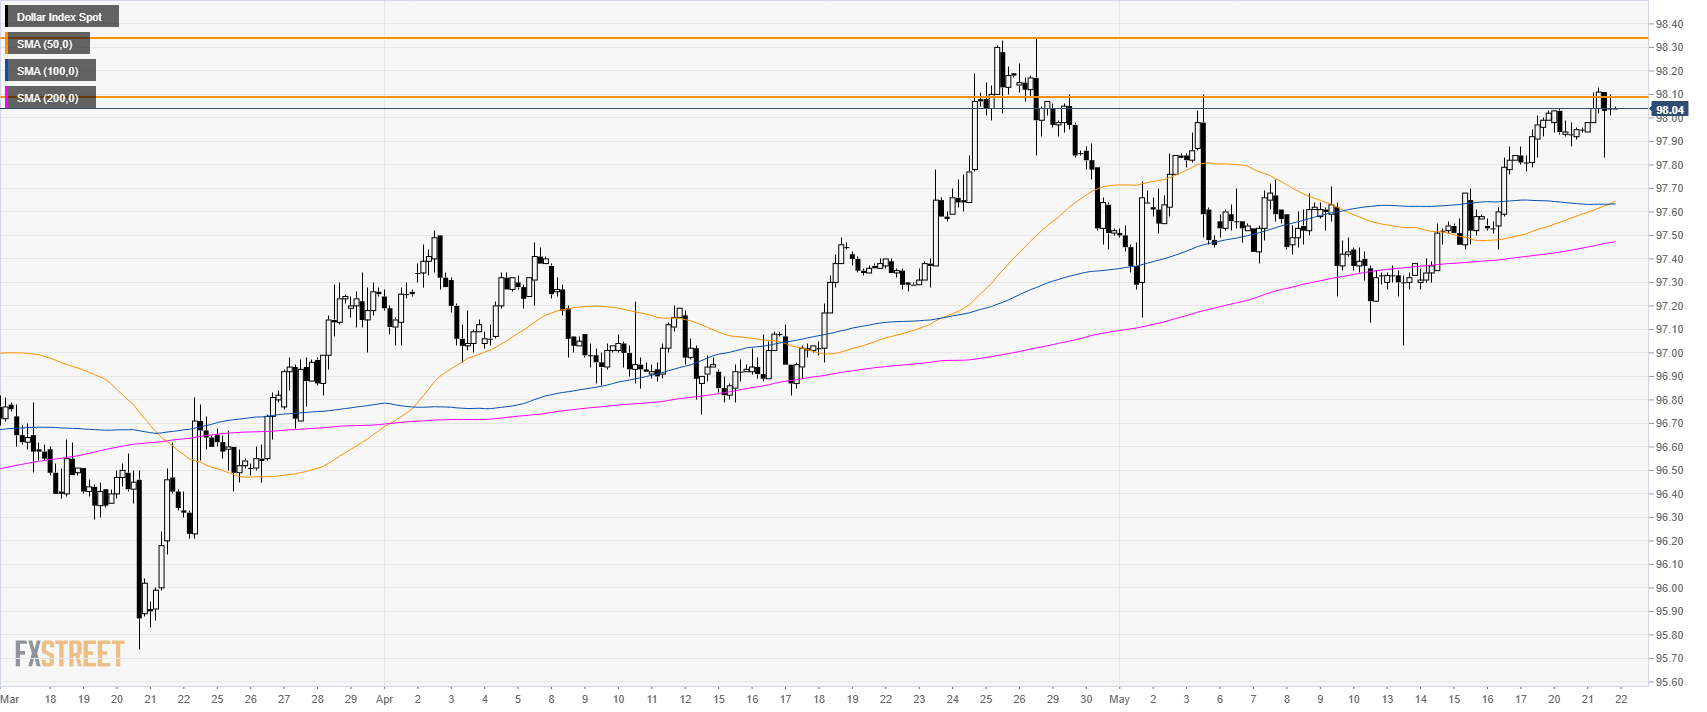
DXY 4-hour chart
The market is trading above its main SMAs suggesting a bullish momentum in the near term. The market reached 98.10 target and the next potential level to look at is likely 98.34, the 2019 high.
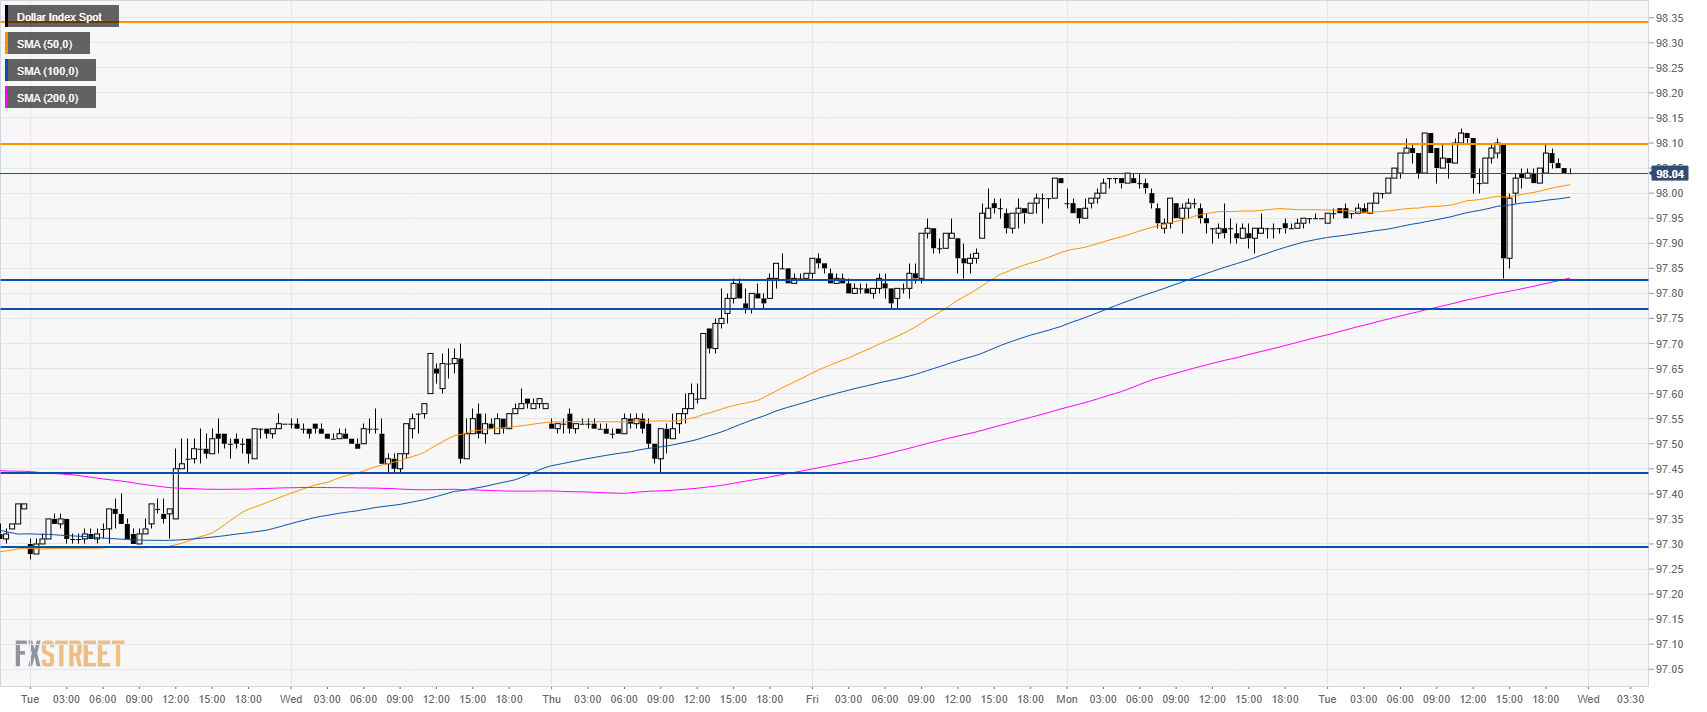
DXY 30-minute chart
The greenback is trading above its main SMAs suggesting bullish momentum in the near term. A breakout above 98.10 can open the gates to 98.34, the current 2019 high. Immediate support is at 97.83 and 97.77 followed by 97.44, May 16 low.
Additional key levels
