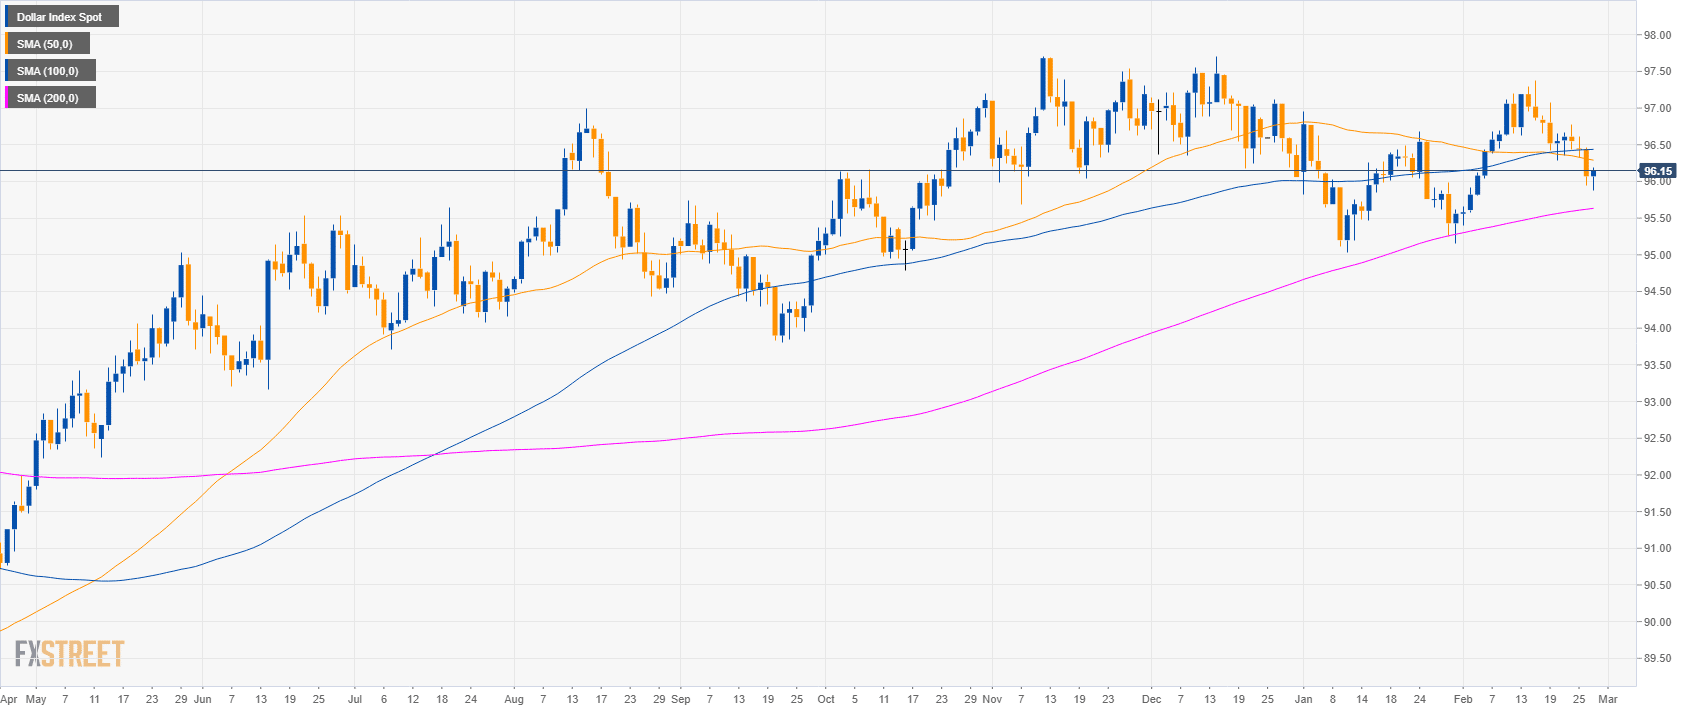
DXY daily chart
- DXY is trading in a bull trend above the 200-day simple moving average (SMA).
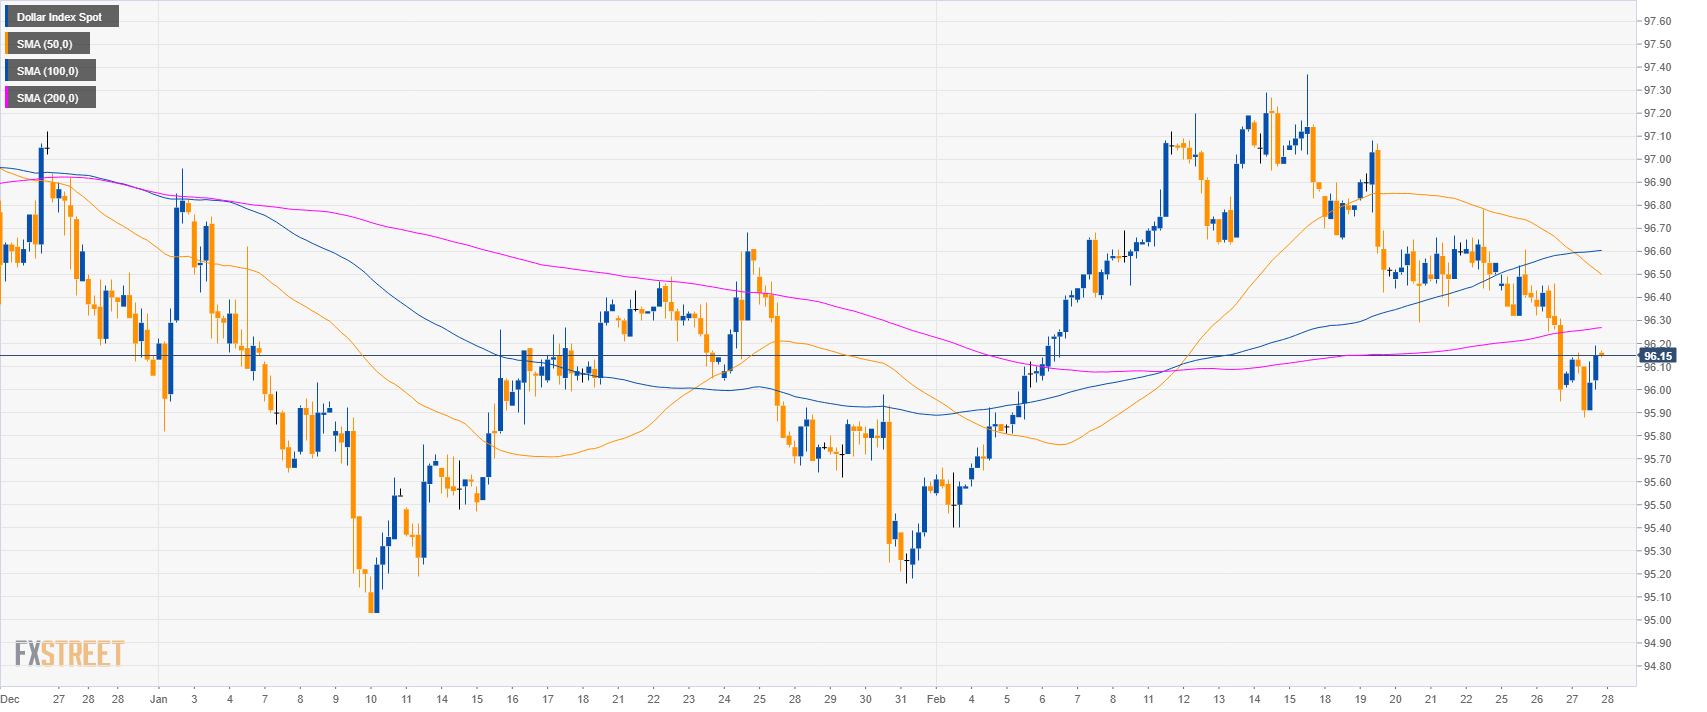
USD/JPY 4-hour chart
- DXY is trading below its main SMAs suggesting bearish momentum.
- The 95.40 bear target remains firmly in place.
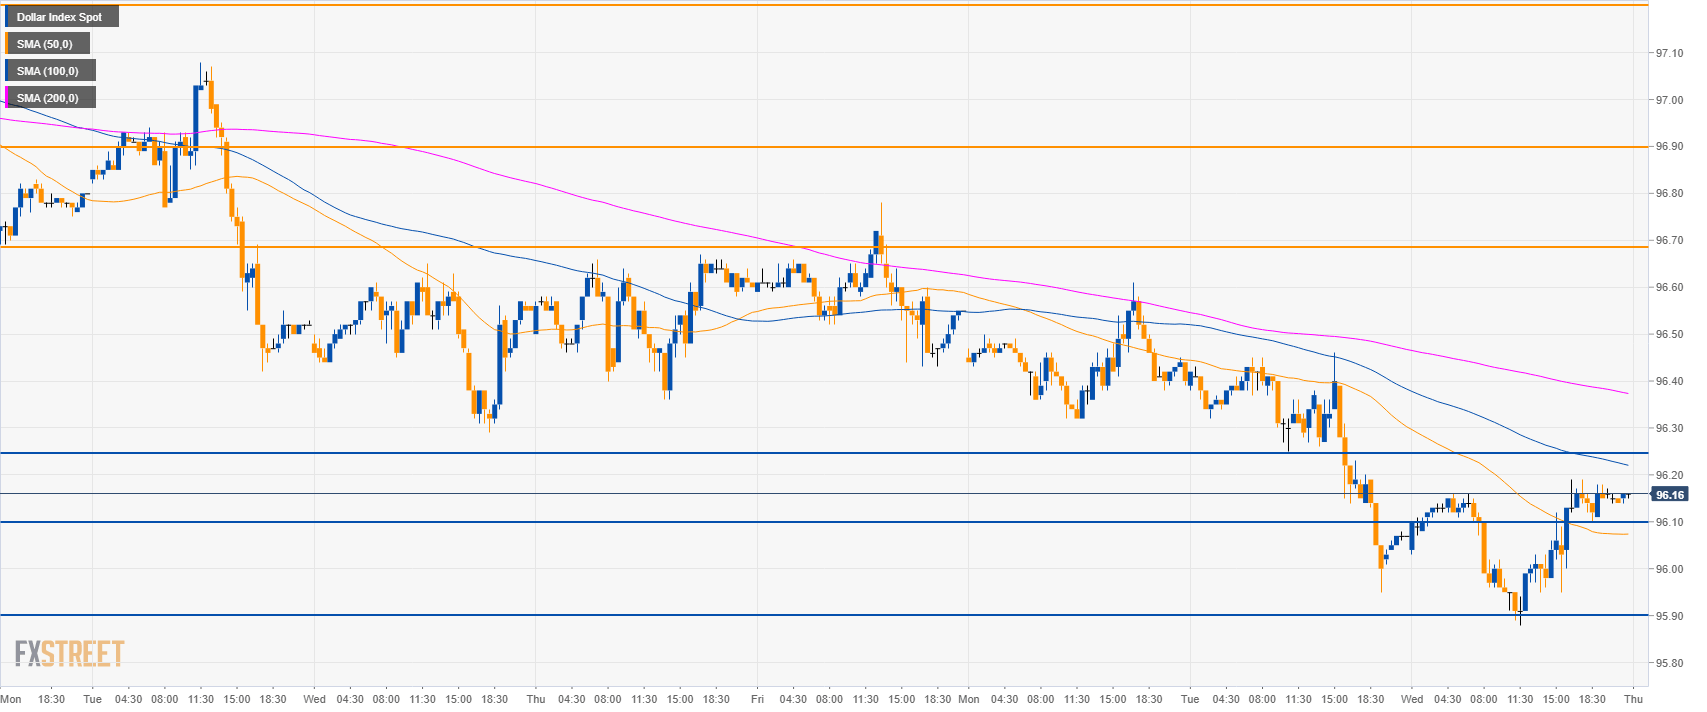
DXY 30-minute chart
- The bulls broke above 96.10 and the 50 SMA. If the market break above 96.25 it can lead to a move to 96.70 in the short-term.
- On the flip side, a break below 96.10 would see a drop to 95.90.
Additional key levels
Dollar Index Spot
Overview:
Today Last Price: 96.16
Today Daily change %: 0.09%
Today Daily Open: 96.07
Trends:
Daily SMA20: 96.43
Daily SMA50: 96.31
Daily SMA100: 96.43
Daily SMA200: 95.62
Levels:
Previous Daily High: 96.46
Previous Daily Low: 95.95
Previous Weekly High: 97.08
Previous Weekly Low: 96.29
Previous Monthly High: 96.96
Previous Monthly Low: 95.03
Daily Fibonacci 38.2%: 96.14
Daily Fibonacci 61.8%: 96.27
Daily Pivot Point S1: 95.86
Daily Pivot Point S2: 95.65
Daily Pivot Point S3: 95.35
Daily Pivot Point R1: 96.37
Daily Pivot Point R2: 96.67
Daily Pivot Point R3: 96.88
