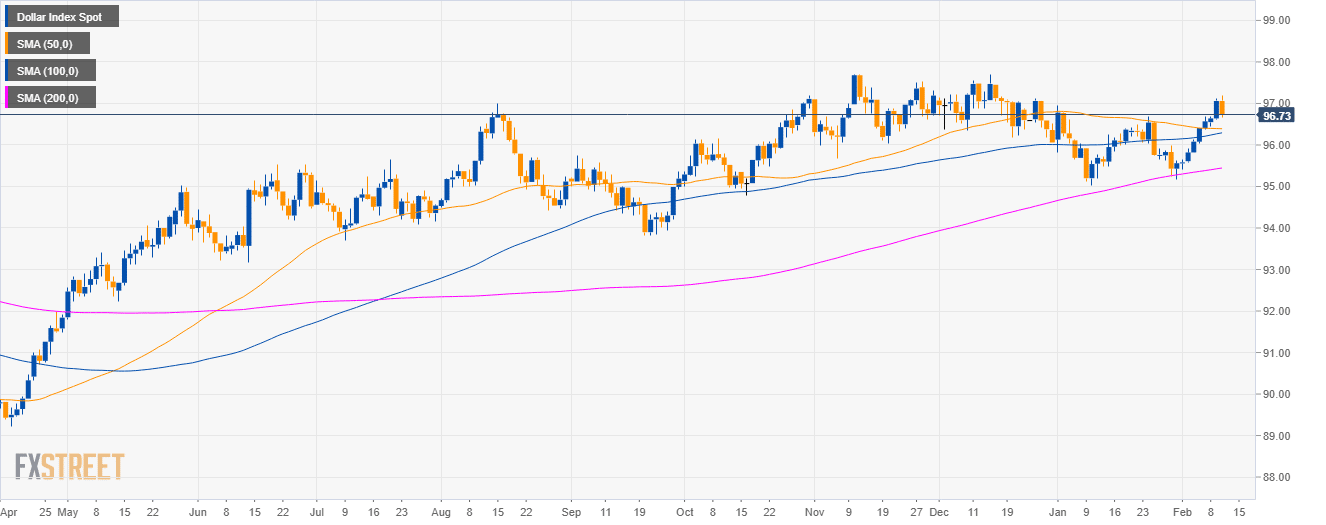
DXY daily chart
- The US Dollar Index (DXY) is trading in a bull trend above its main simple moving averages (SMAs).
- This Tuesday marks the largest daily decline in two weeks for the Greenback.
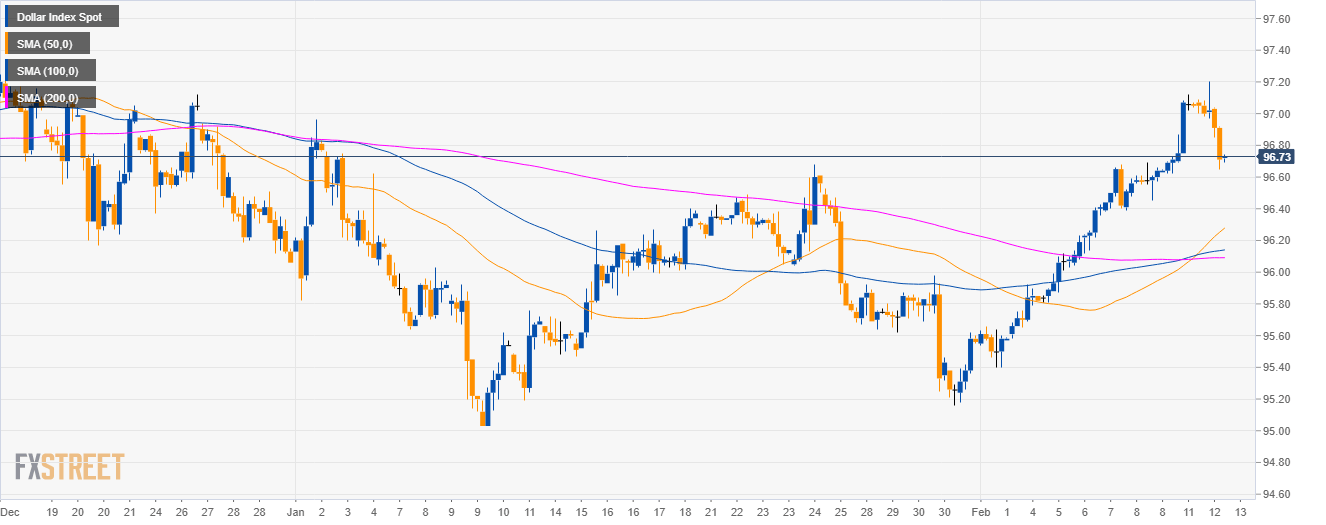
DXY 4-hour chart
- DXY is trading above its main SMAs suggesting bullish momentum in the medium-term.
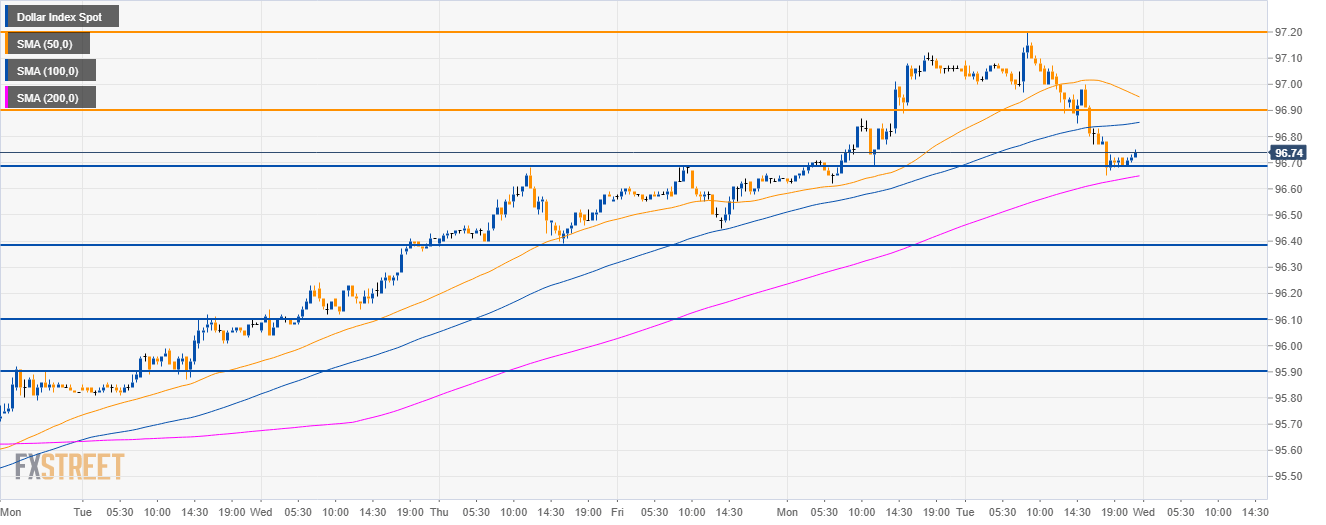
DXY 30-minute chart
- DXY is trading between the 100 and 200 SMAs suggesting a sideways market in the short-term.
- Bulls will try to recapture 96.90 and 97.20 to the upside.
- On the flip sside, a break below 96.70 on a daily closing basis could lead to a decline 96.40 level.
Additional key levels
Dollar Index Spot
Overview:
Today Last Price: 96.74
Today Daily change: -32 ticks
Today Daily change %: -0.33%
Today Daily Open: 97.06
Trends:
Daily SMA20: 96.12
Daily SMA50: 96.4
Daily SMA100: 96.27
Daily SMA200: 95.43
Levels:
Previous Daily High: 97.12
Previous Daily Low: 96.62
Previous Weekly High: 96.69
Previous Weekly Low: 95.58
Previous Monthly High: 96.96
Previous Monthly Low: 95.03
Daily Fibonacci 38.2%: 96.93
Daily Fibonacci 61.8%: 96.81
Daily Pivot Point S1: 96.75
Daily Pivot Point S2: 96.43
Daily Pivot Point S3: 96.25
Daily Pivot Point R1: 97.25
Daily Pivot Point R2: 97.43
Daily Pivot Point R3: 97.75
